Coronavirus cases in tri-state (NY,NJ,PA) region
JHU
worldwide coronoavirus map, US and Canada,
Tri-state
data search , NY,NJ,PA county and state
cases EXCEL file
|
cases |
|||
|
|
New York |
New Jersey |
Pennsylvania |
|
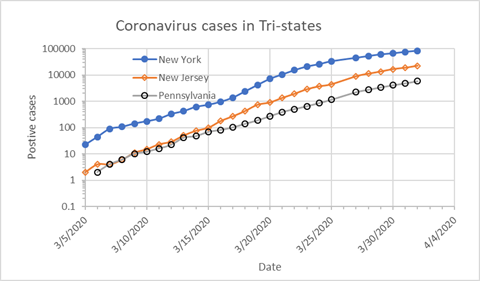
4/1/2020 |
83712 |
22255 |
5,805 |
|
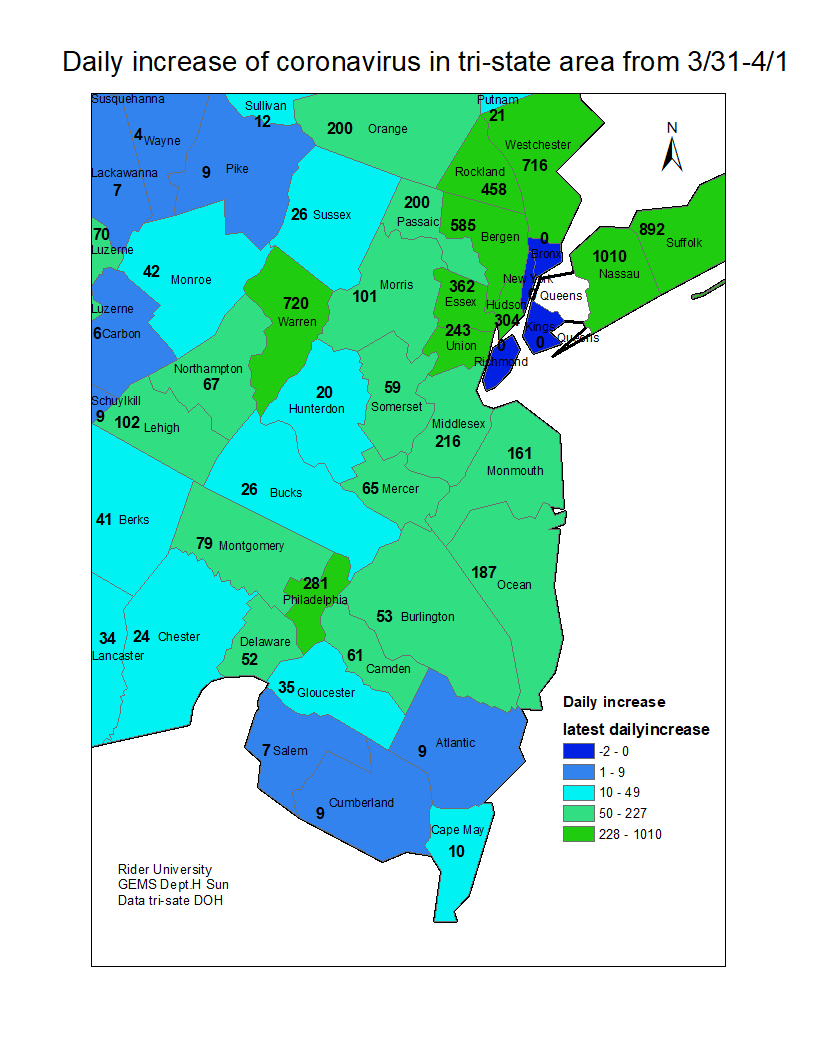
increase from 3/31/2020 |
7,917 |
3,559 |
962 |
|
|
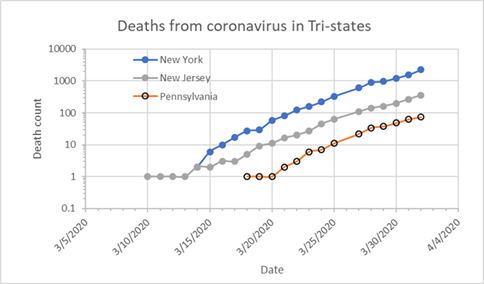
deaths |
||
|
New York |
New Jersey |
Pennsylvania |
|
|
4/1/2020 |
2219 |
355 |
74 |
|
increase from 3/31/2020 |
669 |
88 |
11 |
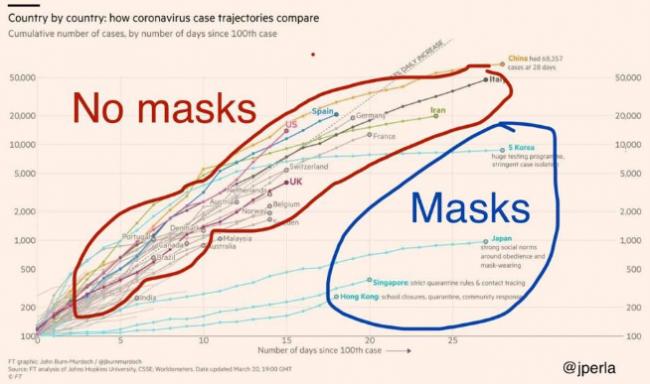
It seems masks do protect you. Wear masks when
you go to public places.
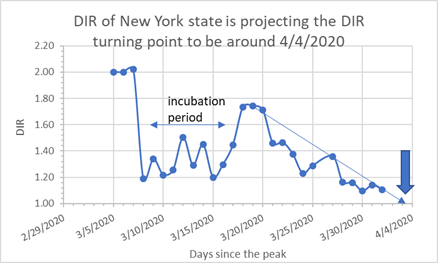
1. When will the daily addition start to
decline in tri-state area? When will the tri-state cases peak?
Based on the DIR (daily increase ratio or
diagnosed incidence ratio) trend in NY, DIR will be 1 (see underneath plot)
around 4/4/2020. If average status of a diagnosed person lasts 3 weeks, NY
coronavirus case will peak around (4+21) 4/25. i.e., there will be more
decrease in cases than increase after that. If it lasts 4 weeks, NY case will
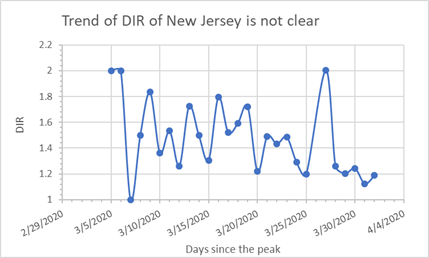
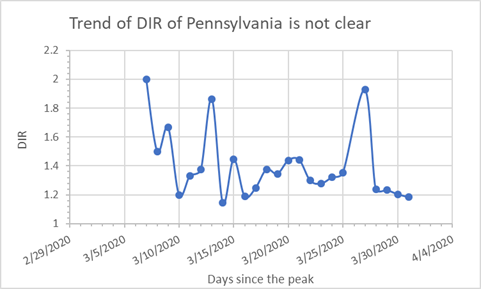
peak around 5/2/2020. However, trends for NJ and PA are not clear.
|
Trend of DIR for
NY seems reaching 1 on 4/4/2020 |
Trend of DIR for
NJ is not clear |
|
|
|
|
Trend of DIR for
PA is not clear
|
DIR: ratio of
diagnosed accumulation of a given day to the diagnosed accumulation of the
prior day |
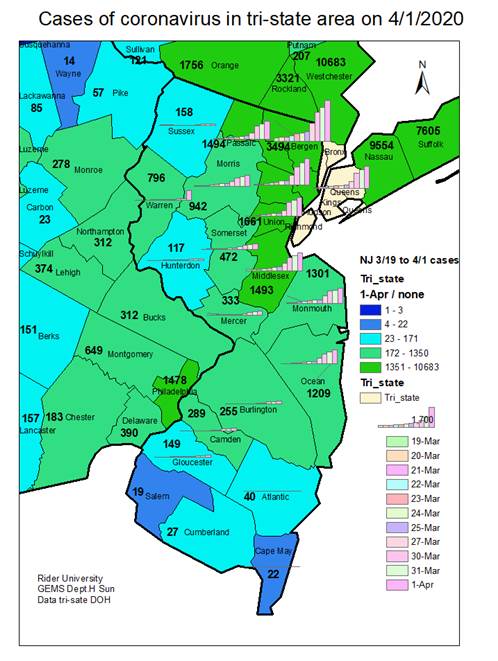
2. County distribution map and NJ county trends
(Tri_state_corona.pdf)
|
|
|
3. Tristate coronavirus case trend
|
|
|
Data sources links
Pennsylvania
Department of Health, New
Jersey Department of Health. New York Department of Health
![]()
Last updated: 4/1/2020. Hongbing
Sun , GEMS department, Rider University