SECONDYEAR (2001) POST-TREATMENT EVALUATION FOR CONTROLLING PHRAGMITES IN THE EAST POOL AT EBFNWR, BRIGANTINE, NJ
![]()
Allison Brown, Hongbing Sun and Frank Petrino
Dept. of Geological and Marine
Sciences,
Final Copy, 2002 Fall
New Figures: Figure1, Figure 2,
Figure 3,
Figure 4, Figure 5, Figure 6,
Figure 7 ,figure 8, figure 12 More figures will be uploaded later.
EXECUTIVE SUMMARY
Field data were collected during August 2001 to evaluate
post-treatment Phragmites height and density at EBFNWR, Brigantine, NJ. Pore
water salinity and pH were measured in-situ at each of the experimental
sites. Pore water cation concentration was evaluated in the ICP
laboratory at
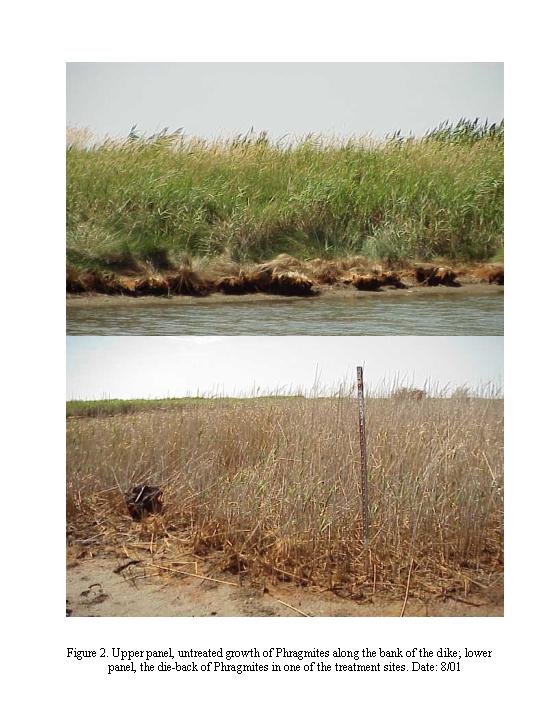
In the East Pool in August 2001, we observed a large area of die-back of Phragmites and large reduction in Phragmites height. Patches of tall form Spartina alterniflora have begun to appear on some of the islands. The spread of Spartina patens and Distichlis spicata to the center of the island patches was also noticeable. The average height reduction of Phragmites in year 2001 over the baseline data in 1999 is 59%. The average reduction in live density is 78%. The accidental post tidal enhancement burn of two of our "tidal enhancement only" sites produced some interesting results. This particular treatment resulted in 85% reduction in Phrag height and a 94% reduction in density--seemingly the most effective treatment. However, these burned plots have yet to be colonized by S. patens and D. spicata and remain fairly barren of vegetation.
In the East Pool, the average salinity of 32 ppt in the year 2001 is about four times higher than the average salinity data of 6.7 ppt in year 1999. The 32 ppt is also about 17% higher than the average salinity of 26.7 ppt measured in 2000. There was not a significant change in the soil water pH. Only a 10% decrease in pH (4.5) was detected in 2001 over the average pH (5) in soil water in 1999. The concentration of magnesium measured in 2001 is about 2.2 times larger than the concentration of magnesium measured in 1999 in East Pool. The concentration of K+ is about 5 times larger than the concentration measured in 1999. Calcium concentration on the other hand, has been relatively stable from year 1999 to 2001, even though the salinity changed significantly. We think the stability of the calcium is related to the stability of the pH values measured. Soil sampling revealed that there was a reduction in the adhesiveness of soil particles due to the reduction in the live roots of Phragmites as a result of decomposition. The adhesiveness of soil particle might affect the long-term stability of the island patches. Other changes in the soil characters including the soil colors are less obvious.
After we compared the effectiveness of the different
treatment methods, it is our preliminary conclusion that the tidal enhancement
may be the most effective treatment method in reducing the growth of
Phragmites. While burning might reduce the above ground biomass, combining
burning with tidal enhancement after a large die-back of Phragmites may not be
recommended, because the burning may damage the recolonization of the new plant
species.
At the present time, the east pool is at a transitional stage from a brackish
water to a salt water marsh. While we are pleased with the quick
eradication of Phragmites, we are also concerned about the slow
colonization of other species during this transitional stage. We estimate that
it might take about two years before the salt marsh ecosystem can be
stabilized. Our recommendation is that the ecosystem be closely monitored to
evaluate plant and hydrogeochemical conditions during this period to assure
that a desired healthy ecosystem can be established in East Pool.
INTRODUCTION AND BACKGROUND
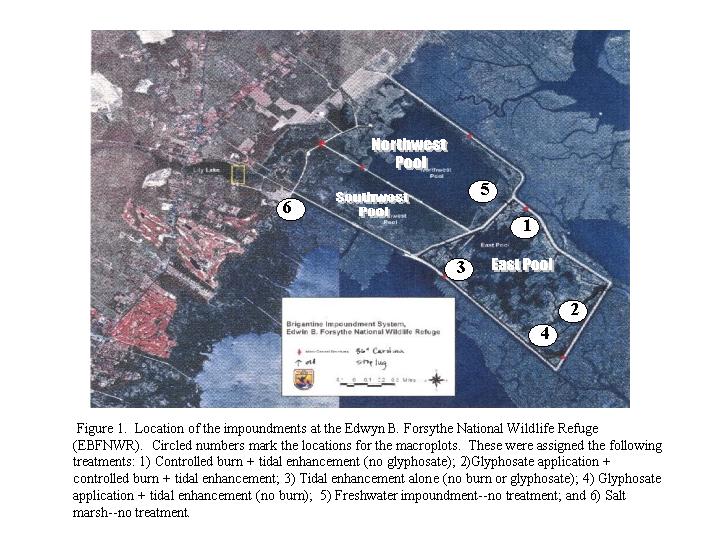
The discussion for controlling Phragmites in the East Pool began with Paul Steblein and Kelly Hogan in the fall of 1998. We learned from Paul and Kelly that since its construction in ~1953, the East Pool had succumbed to a Phragmites invasion resulting in altered waterfowl habitat, and a reduction in plant species diversity. The effort to control the plant using existing management strategies was very costly with few benefits realized as the plant continued to grow and spread. Our experiment was initially designed to 1) to evaluate different treatments and treatment combinations proposed for controlling Phragmites in the East Pool; 2) to pinpoint the most cost effective and environmentally sound strategy for Phragmites control and 3) to identify factors that favour or suppress Phragmites growth. The treatments included those which were already in effect for the East Pool (namely an autumn 1998 glyphosate application (4 pts per acre) and a Feb. 1999 prescribed burn), and tidal enrichment which was newly proposed for July 1999. We selected the locations for the six different macroplots (described below) based on staff recommendations, as well as site access and funding constraints.
The treatment combinations for the East Pool that we consider in this report include: 1) Tidal enhancement alone (TE, initiated July 1999); 2) TE + G + Burn (G, September 1998, B, March 1999); 3) TE + Burn (B, March 2000-- Accidental); 4) TE + Glyphosate (G, September 1998);. We also established several reference macroplots for comparision to the treatment macroplots --one in the the NW Pool (Brackish Marsh Control) and one near the Leeds Trail boardwalk ( Salt Marsh Control). Macroplots marked with a have been altered or moved.
The project has proceeded in the following phases according to funding
availibility and site access constraints:
1) December 1998 to February 1999: Pre-treatment Phragmites
density, height, soil, and pore water data were collected;
2) January - February 2000: The first year post treatment Phragmites
growth and associated pore water data were collected;
3) August - October 2000: Phragmites growth data ONLY were collected;
4) August 2001: The second year post-treatment Phragmites growth, soil, and
associated pore water data were collected. In addition, a plant species
list was compiled;
5) October 2001: An aerial photo survey was conducted.
Since the projects inception, EBFNWR has experienced a considerable staff
turnover. Kelly Hogan left the preserve in 1999, followed by Paul Steblein in
Spring 2000. It was not until the summer of 2001 that the monitoring of
the Phragmites and geochemical conditions fully resumed thanks to the efforts
of Tracy Casselman and Steve Atzert from refuge. After
The current report includes field, laboratory and statistical data analyses for summer of 2001 and compares this data to those collected in previous years.
METHODS AND SITE DESCRIPTION
1. Macroplot Descriptions and GPS data
Macroplots were assigned to different locations in the wetland complex in
order to identify pre-and post treatment Phragmites growth, soil, and
associated pore water conditions. Each macroplot ( up to an acre in size)
now consists of at least two and as many as seven subunits. Each subunit
consists of a vegetation patch generally dominated by Phragmites (although
several subunits lack Phrag). Description of sampling protocols are detailed in
parts 4 and 5 below.
Most subunits were monumented with t-stakes and GPS location data recorded
where needed. GPS locater information is in Appendix 1.
Macroplots were chosen based on EBFNWR staff recommendations and reflect target treatment areas and site access constraints. Originally there were 6 macroplots. Macroplot 7 was added in winter 2000 to replace Macroplot 5 and Macroplot 8 was added in summer 2001 to replace Macroplots 5 and 7--both of which had been treated with glyphosate and/or burned (see below). In addition, some of the Macroplots** were exposed to treatments that we had not originally planned for. The macroplots, subunits, and associated treatments are itemized below. All subunits were dominated by Phragmites, except where indicated.
Macroplot 1: Tidal Enhancement Only **(TE Only)
4 Subunits: L1, L2, L3, and L4
Macroplot 2: Tidal Enhancement + Glyphosate + Burn (TE + G + B )
7 Subunits: A, B, C, D, E, F, G
Macroplot 3: Tidal Enhancement Only** (TE Only)
3 Subunits: H, I, and J (1999)
H, I2, and J2 (2000 - present)
Tidal Enhancement + Burn (TE + B)
2 Subunits: I and J (2000 to present)
Macroplot 4: Tidal Enhancement + Glyphosate
2 Subunits K1 and
Macroplot 5: North Pool Control (1999)
3 Subunits: A, B, and C
Macroplot 6: Salt Marsh Control
3 sample areas: A, B, and C
Macroplot 7: South Pool Control (2000)
3 Subunits: A, B, and C
Macroplot 8: North Pool Control (2001)
2 Subunits: A and B
2. Description of Treatment Protocols Implemented by EBFNWR Staff
Tidal Enhancement Alone (TE Only): Untreated plots were subjected to tidal enhancement in July 1999. Macroplot 1 ( SU L1-L4) and Macroplot 3 (SU's H, I2, J2) were combined for this data (Macroplot 1 was not burned as we had intended).
Tidal Enhancement + Glyphosate (TE + G): Macroplot 4 was treated with aerial applications of glyphosate in September 1998 at 4 pints per acre. The plot was then subjected to tidal enhancement in July 1999.
Tidal Enhancement + Burn (TE + B): Macroplot 3 (SU's I & J) were accidentally burned in spring 2000. This took place after tidal enhancement (summer 1999).
Tidal Enhancement + Burn + Glyphosate (TE + B + G): Macroplot 2 was treated with aerial applications of glyphosate in September 1998 at 4 pints per acr. The plot was subsequently burned in Feb./March 1999 and then subjected to tidal enhancement in summer 1999.
Control (No Treatment): Macroplot 5 was assigned to the North Pool in winter 1999. This plot was accidently treated with glyphosate later that year, so the control plot was moved to the Southwest Pool (M7) the following winter (2000). This new plot exhibited almost complete die-back in summer 2000 suggesting it, too, had been sprayed with glyphosate. A new control plot (M8) was established in the North Pool in summer 2001.
3. Field Data Collection and Measurement Periods
We have conducted four different field surveys since the projects inception in 1999. A pretreatment vegetation, soil, and pore water chemistry survey was conducted in the winter of 1998-99 ( 12/29/98 through 3/17/99). Funding was not available for a summer 1999 post treatment survey. A first year post treatment survey was conducted in winter 2000 (1/14/00 through 2/12/00). Another first year post treatment survey (focusing on vegetation changes) was conducted in summer/early fall 2000 (8/4/00 through 10/10/00). Funding was not available for a winter 2001 post treatment survey. The second year post treatment survey was conducted during summer 2001 (8/3/01 through 8/29/01). In lieu of limited funding and seasonal access constraints, we have decided to shift our vegetation monitoring period to the summer / early fall periods.
4. Methods Used for Measuring Plant Density and Height
A pilot survey conducted in East Pool Macroplot 1 and North Pool Macroplot 5 during winter 1999 identified the most efficient sampling design given the limited budget and access constraints. Methods used follow those recommended by Elzinga et al. (1999). Culm densities were measured in each subunit patch of Phragmites using a minimum of eight--0.5 M x 1M (0.5 M2) vegetation frames (quadrats). The "caliper" frame was poised over the vegetation successively in a belt dissecting the center of each Phragmites patch. The frame's unique design permits the operator to enclose tall plants to be sampled with greater precision and ease. The observer avoided walking in the region which was being sampled. Phragmites total density (# culms per 0.5 M2) was estimated in all macroplots (except M 6 Leeds--no Phragmites) on different sampling dates, as noted above. All dead standing biomass was included (burned stubs were ignored). During the summer 2000 and summer 2001 sampling period, we additionally measured live density (# live culms per 0.5 M2). The number and identification of the subunits is itemized in (1) above.
Plant height was measured in all macroplots except EP-L and 6
5. Methods used for Measuring Hydrogeochemical and Soil Conditions
a. Porewater Chemistry
Porewater salinity was measured using a hand-held refractometer. PH was measured with a portable pH meter. Measurements were made during each sampling period (except summer 2000) in the East Pool, North and/or South Pool, as well as in the adjacent Spartina marsh. A minimum of three replicate measurements were made per macroplot in Winter 2000 and Summer 2001. In addition, several measurements were made in the channels surrounding the East and South pools and the Spartina marsh.
Porewater samples were collected on the dates above for the quantitative analysis of metallic elements in solution. Samples were filtered, diluted with double distilled H20 (10 to 100x depending on salinity of samples), and analyzed with a Baird ICP 2070 Sequential Plasma Spectrometer. The instrument was calibrated with Bairds #2 Standard solution to quantify K, Ca, Fe, Mg, and Zn elements in solution. In 2001, we added Na and eliminated Fe and Zn.
b. Sediment Profiles
Approximately seven freshwater soil cores each around 2.5 cm wide x 3.5 m
deep were drilled with manual soil augers in the East Pool (Macroplot 2) on
January 19, 1999). Several additional cores were sampled in the North
Pool (Macroplot 5) and in the Spartina marsh (Leeds-Macroplot 6) on February
13, 1999. Sediment profiles from the freshwater impoundments were compared with
those from the Spartina marsh. The sediment profile analysis was repeated on
August 28, 2001 in the East Pool (Macroplot 2) and in the new North Pool
control site (Macroplot 8). Methods for soil analysis followed Brady and
Weil (1998). Soil texture, composition, and color were described in situ.
6. Statistical Methods
One-way ANOVA power tests were performed in 1999 to identify sample size and minimum detectable difference in plant density and height needed to conclude whether a given treatment was effective or not (Elzinga et al., 1999; Zar, 1984). For plant height, it was determined that a minimum sample size of 24 measurements (in cm) per macroplot (8 per subunit) would be needed to have a 90% probability of detecting a difference of 40 cm between the population means (a = 0.05). A smaller detectable difference would require a larger sample size (for example, a difference of 30 cm needs 48 measurements per macroplot). For plant density, it was determined that a minimum sample size of 36 quadrats (each 0.5 x 1M) per macroplot (12 per subunit) would be needed to have a 84% probability of detecting a difference of 21 plants (using a 0.5 x 1M quadrat) between population means (a = 0.05). This would require at least a 50% post treatment reduction in density for us to conclude that a particular treatment was effective. A smaller detectable difference would require a larger sample size [ for example, a difference of 15 plants (35% post treatment reduction) would require 72 quads (24 per subunit) per macroplot]. Due to budget and access constraints, we opted for fewer quadrat numbers in some of the macroplots in 1999. To compensate for this, all 1999 macroplot data for the East Pool was combined as "untreated" data to increase the rigour of the analysis. To satisfy the assumptions of ANOVA, square root transformations were performed when necessary. One-way ANOVA's were used to compare the 1999 data to the 2001 data. Means, standard errors, and percent differences were calculated from replicate values for each macroplot. Multiple comparisons were performed using Scheffe F-tests (a = .01). For the ICP data, the instrument accuracy was estimated for each element using the coefficient of variation. This value was obtained by five repeated measures of an unknown during the course of the analysis. Standard errors were also calculated for each element using the repeated measure data.
RESULTS
A. PLANT DATA
1. Year to Year changes in Phragmites Density and Height (Figures 2 - 4)
Tidal Enhancement Alone (TE Only): Plots showed a 66% reduction in live culm density from winter 1999 to summer 2001, with an average of ~ 32 plants per square meter remaining. Total density (including dead biomass) increased by ~43%. The height of the standing biomass was reduced by 36% (-26 inches).
Tidal Enhancement + Glyphosate (TE + G): Plots showed a 61% reduction in live culm density from winter 1999 to summer 2001, with an average of ~32 plants per sq m remaining. Total density (including dead biomass) increased by ~56%. The height of the standing biomass was reduced by 53% (-44 inches).
Tidal Enhancement + Burn (TE + B): Plots showed a 94% reduction in live culm density from winter 1999 to summer 2001, with an average of ~6 plants per sq m remaining. Total density (including dead biomass) decreased by 64%. The height of the standing biomass was reduced by 86% (-53 inches).
Tidal Enhancement + Burn + Glyphosate (TE + B + G): Plots showed a 74% reduction in live density from winter 1999 to summer 2001, with an average of ~ 16 plants per sq m remaining. In summer 2000, a marked surge in live density was noted for this macroplot (148 plants per sq m). This is reflected in the large quantity of dead standing biomass witnessed the following summer (2001) when total culm density was estimated at 300 per sq m. The height of the standing biomass was reduced by 65% (-45 inches).
Control (No Treatment): Because the original control macroplot had to be moved, year to year comparisons cannot be made to identify seasonal or phenological changes. However, treatment data may be compared to control data for any one year. Live densities for the control site during 2000S (158 /M2) and 2001S (66 /M2) were more than double those of most treatments (except for TE + G + B in 2000, as noted above). For height, dramatic differences were noted between the control and treatment plots for 2001. Plants in the control plots had heights often exceeding 260 cm (~8.5 feet) whereas plants in the treatment plots ranged from 16 cm (6 inches) in the TE + B treatment to 142 cm (~ 4.6 feet) in the TE Only treatment.
2. Comparison of Treatments on Phrag Density and Height (Figures 5 -6)
LIVE DENSITY (Figure 5a): ANOVA revealed highly significant differences in live density (F = 30.41, p = .0001) between the treated (2001)and untreated (1999) plots. All treated sites showed significant reduction in live biomass compared to the control and pretreatment data (p < .01). TE + B showed significantly lower densities compared to TE Only ( p < .01). TE + G and TE + G + B were not significantly different from either of these treatments.
TOTAL DENSITY (Figure 5b): ANOVA revealed highly significant differences in total (dead + live densities) between the treated (2001) and untreated (1999) plots (F = 74.854, p = .0001). Dead standing biomass was highest in the TE + G + B macroplot (p < .01). There was no difference between the TE + G and TE Only treatments. TE + B had the lowest standing biomass of all the treated sites (p < .01) , but not significantly lower than the control site.
TOTAL vs. LIVE DENSITY (Figure 6a): The percentage of total standing biomass that was living was lowest in the TE + G + B macroplot. Other treatments had similar percent values ranging from 15 - 20%. The control and pretreatment macroplots had the highest percent of live biomass (~ 85%).
TOTAL HEIGHT (Figure 6b): ANOVA revealed highly significant differences in total height (cm) between the treated (2001) and untreated (1999) plots. Total height in the Control macroplot was significantly higher than all other plots, including the pretreatment heights (p < .01). Total heights for the TE + B macroplot were the lowest of all the macroplots (p < .01). TE + G and TE Only heights were not significantly different, but were greater than the TE + G + B treatment ( p < .01).
3. Phrag Inflorescences:
During the period of observation (August 3 - August 29, 2001) there were noted differences between the phenological patterns in plants found in the East Pool treatment macroplots and plants found in the North Pool control macroplot. The control plots displayed vigorous development of inflorescences. Very few, if any inflorescences were noted in the treatment plots. Inflorescences were beginning to appear in the TE + G macroplot towards the end of our field season, but were scant. It should be noted that a seed viability test was performed in winter 1999 from samples sent to Rider by Kelly Hogan. The seeds were shown to be non-viable based on a tetrazolium assay.
4. Plant Species Composition and Fauna associated with Phrag Macroplots
1). NORTH AND SOUTH POOLS (Control Macroplots):
North Pool Macroplot 5 (10/10/00): This site has dramatically changed since winter 1999 when Kelly Hogan helped us to establish this as a control plot. There is evidence that Subunit (SU) A + C were burned (in addition to the glyphosate tx in Sept. 99), and Walter's Millet is aggressively colonizing the area near SU A, replacing Phrag. Only 4 - 5 individuals of Phrag remain in SU A, which was dominated by this species in 1999. SU B cannot be located, but SU C is supporting vigorous Phrag growth. 2 - 5" of surface water evident. Plants observed along water's edge and borders were as follows (based on superficial survey). A porometer was installed to monitor salinity:
Echinochloe walteri
Polygonum sp.
Solidago sempervirens
Pluchea purpurescens
Euthamia graminifolia
Aster sp.
South Pool (10/10/00?): This site (on south western boundary of marsh near berm) was dedicated as the new control site in winter 2000 to replace Macroplot 5 (old control site) which had been treated with glyphosate and burned. The site was selected based on Paul Steblein's recommendation. However, upon returning to the site, we found it was dominated by dead Phrag, suggesting it, too, had been treated. Our inspection of the site revealed very anaerobic and unconsolidated organic muck. Given the funding and time restrictions, we were unable to establish a new control site in 2000. Plant species observed included the following (based on superficial survey using binoculars due accessibility constraints):
Pluchea purpurescens
Iva frutescens (dead)
Eleocharis parvula
Utricularia sp.
Cyperus strigosus
Hibiscus moscheutos (?)
Echinochloa walteri
North Pool Macroplot 5 (8/17/01): The SU A was located. It is found that the number of live Phrag individuals increased to 15, with average height of 164 cm (~5 ft). For the most part, SU A is dominated by Walter's Millet. SU C supported a healthy stand of Phrag. It is hard to believe this site was treated with glyphosate and burned in 1999! Couldn't find porometer. was it removed? SU B still was unable to be located! Other species observed (based on superficial survey):
Echinochloe walteri
Cyperus sp.(abundant!)
Aster sp.
Euthamia graminifolia
Pluchea purpurescens
Polygonum sp.
North Pool Macroplot 8 (8/17/01): This macroplot is the newest control site to be established. There are large stands of Phrag in SU A and SU B, which have been staked. Bare areas near SU A are rapidly being colonized by runners from the nearby Phrag colony.
Echinochloa walteri Solidago sempervirens
Iva frutescens Scirpus pungens
Baccharis halimifolia Erechtites hieracifolia
Polygonum pensylvanicum Pluchea purpurascens
P. punctatum Juncus effusus
Cyperus odoratus E. graminifolia
C. erythrorhizos Euthamia tenuifolia
C. diandrus Anaphalis margaritaceae (near road)
Kosteletzkya virginica (?--did not key)
2). EAST POOL (Treatment Macroplots):
10/3/00: Macroplot 4 (SE corner of East Pool). Avocet sited by visitor. Fiddler crabs are abundant; are they eating decaying Phrag leaves? Plants seen here and in other macroplots of the East Pool as follows:
Iva frutescens
Baccharis halimifolia
Toxicodendron radicans
Spartina patens
S. alterniflora
Distichlis spicata
Sesuvium maritimum
Cyperus strigosus.
Pluchea purpurescens
Salicornia europea
Solidago sempervirens
8/24/01: Vigorous stands of Spartina patens and Distichlis spicata appear to be replacing Phragmites in East Pool macroplots 1, 3, and 4. In the East Pool Macroplot 2, , S. alterniflora is becoming established in patches that ranged in size from 1 square foot to 6 square feet. In the plots that were burned following tidal enhancement (TE + B), it does not appear as if Phragmites is being replaced by salt marsh species and these areas remain fairly barren. Die-back of woody plants including Baccharis halimifolia, Iva frutescens, Toxicodendron radicans and Juniperus virginiana is evident particularly in low elevation islands exposed to greater flooding with salt water. Plant species diversity appears to be lower. Dead material seems to be undergoing rapid decomposition, and old snags are providing refugia for birds (many egrets were seen using dead snags during sampling period). Fiddler crab activity noted in macroplot 4.
S. patens
Distichlis spicata
Sesuvium maritimum
S. alterniflora
3). SALT MARSH
Adjacent to Macroplot 4 near water control structure ( 8/22/01): S. alterniflora appears to be the dominant species in the salt marsh islands adjacent to the East Pool. S. patens is also abundant. Casual observation revealed the following species:
S. alterniflora
S. patens
Limonium cf. nashii (check flowers--could be L. carolinianum)
Salicornia bigelovii
Leeds Trail Control Macroplot 6 (8/24/01): This site seems to have become more brackish since we began our study. It would be interesting to know if diversion of fresh water from the East Pool impoundment has increased fresh water exchange with the surrounding tidal marsh.
S. alterniflora (less abundant!)
S. patens
Atriplex patula
Iva frutescens
Solidago sempervirens
Erechtites hieracifolia
Baccharis halimifolia
5. Aerial Photo of East Pool
The aerial photo shoot conducted in October 2001 with the assistance of the Atlantic County Mosquito Abatement District was unfortunately compromised due to government mandated restrictions against higher altitude flights. We were only able to reach an altitude of 1000' and needed to be at 5000' to get a panel photo series of the East Pool. None-the-less approximately 80 photos were taken, and will be evaluated for possible inclusion in a future report. It would be desirable to try again in September 2002, if additional funding is available.
B. HYDROGEOCHEMICAL AND SOIL DATA
1. Hydrology
We noticed about 1 foot high of brown water marks left on the stems of
Phragmites in almost all the island patches. Staff wildlife manager Tracy
Casselman, suggested that it was the mark left from about two-months of stacked
high tide water left in the East Pool impoundment in May and June 2001. We
believe that the extended exposure of young plants to standing salt water may
have contributed to the dramatic reduction in live Phragmites in the East
Pool. During the August sampling period, we observed a mosaic of cracks
on exposed mud surfaces in portions of the East Pool suggesting that these
areas were not frequently submerged in tidal water. Some thin white films of
salt were noticed deposited on the edges of some island patches. The
water level data along two water discharge gates were collected by Amy Jones
who is a staff of EBFNWR on a weekly basis. We might be able to interpolate the
hydrology data into a longer period on an hourly basis based on the tide data
in a later time.
2.
Tracy Casselman alerted us to his concern that island patches had begun to
erode due to shock that the system sustained with extended retention of salt
water in May- June 2001. During the summer of 2001, he noticed that
Spartina patens had started to die back along the margins of the islands.
This and other upland salt marsh species cannot tolerate extended submersion in
salt water. In the absence of healthy roots serving to stabilize
sediments, islands could begin to slump or erode. We received an
email message from
3. Pore Water Chemistry
a. Salinity and PH (Figures 7-9)
The averaged salinity in the tidal enhanced East Pool changed from 6.7 ppt in 1999
winter to 26.7 ppt in summer of 2000 (which is 3 times larger than 1999s
salinity level). The average salinity is 32 ppt in summer of 2001 which is
about 4 times larger than the salinity level in 1999 (Figures 7-9). The
salinity in the controlled freshwater Northwest Pool and edges of the tidal
marsh where we collected our water samples, all decreased from10% to 43%.
The decreases of salinity in those sampled area may be the result of the
increased freshwater seepage.
The average pH level in the east pool decreased by 4% and 10% in 2000 (pH=4.8) and 2001 (pH=4.5) respectively compared with the pH level in the winter of 1999 (pH=5). The average pH of summer 2001 in both the control site and salt marsh both shown a similar percentage (~10%) of decrease from that of 1999. The average pH was 3.9 in the control site and was 6.4 in the salt marsh in summer of 2001 (Figures 7,8). The low pH in both the treated East Pool and the control site of Northwest Pool are related with the high organic contents in the soil. Variations of salinity and pH in different treatment sites exist. However, we do not believe there are significant differences in pH and salinity variation resulted from different treatment methods (Figure 9).
b. Cations (Figures 10-11)
The changes of cation concentration in the soil water were also significant in
the East Pool (Figures 10-11). The concentration of magnesium (Mg++) increased
127% times in 2000 winter and increased 222% from the concentration level of
Mg++ in 1999 winter. The concentration of potassium (K+) increased 268% in 2000
and increased 501% from the base levels in 1999. However, the concentration of
calcium both in 2000 and 2000 shows a less than 10% decrease from the level in
1999. We think the level of calcium is more inter-controlled by the pH level in
the water. Unless there is a sharp change in the pH levels, we would not expect
to see a significant change in the calcium concentration. Because we did not
have a good record of sodium in year 1999 and 2000, we did not do any
comparisons of sodium with the data in 2001. The changes of cation
concentration in both the control sites and salt marsh from year 1999 to year
2001 were not as drastic as in the East Pool (Figure 11). Some variations
in the concentrations of measured cations in different treatment sites in
summer 2001 were observed (Figure 10). The concentrations of Mg++, K+, Ca++,
Na+ from TE+B sites show some apparently differences from concentrations of
cations from the sites of other type of treatment.
4. Soil Profiles (Figure 12)
The obvious change we noticed in the field regarding the soil from the soil
cores is the significant decrease in soil adhesiveness. During the
collection of the soil samples back in 1999 and 2000, there were large amount
of live Phragmites roots. Most of the roots were noticeably decomposed this
time in August of 2001. We think a decrease in the soil adhesiveness because of
lack of live-roots to grab the soil might be potential concerns for the erosion
of the island patches if live plants do not return to the patches in a few
years.
C. PHRAG VIGOR AND PORE WATER CHEMISTRY RELATIONSHIPS
1. Phrag Height vs. Pore Water Chemistry :
Extremely significant negative relationships exist between Phragmites height and 1) Salinity (F = 44.61, .0001, n = 16); 2) Potassium (F = 32.56, p = .0001); 3) Calcium (F = 9.16, p = .0091); 4) Magnesium (F = 47.05, p = .0001), and Sodium (F = 35.185, p =.0001). The relationship between pH and height was insignificant, although removing 2 outliers (NWA and NWB) unveiled a positive relationship for subunits in the East Pool (F = 16.61, p = .0015, n = 14).
2. Phrag Live Density vs. Pore Water Chemistry
Extremely significant negative relationships exist between Phragmites live
density and 1) salinity (F = 30.811, p = .0001, n= 15); 2) potassium (F=
41.68, p = .0001), 3) magnesium (F= 33.23, p = .0001), and sodium (F= 15.40, p
= .0017), and to a lesser extent, 4) calcium (F = 7.194, p = .0188). With
the removal of 4 outliers (NWA, NWB, EP-A2, and EP-K2) the
relationship between pH and Phragmites density became positive (F = 24.57, p =
.0006, n = 12).
DISCUSSION
1. Changes of Plant Growth in the East Pool Due to Treatments
Tidal enhancement (TE Only) in the East Pool macroplots resulted in a
dramatic reduction of live Phrag density and total Phrag height, compared to
the control and to the pretreatment data. The number of live culms was reduced
from a pretreatment value of 93 per sq. meter in 1999 to 80.5 per sq. meter in
2000 to the most recent estimate of 32 per sq meter in 2001 (nearly one third
of the starting density in 2.5 years)! The most recent density estimate
for the reference plots in the Northwest Pool was ~66 per sq.
meter---more than double the East Pool TE Only treatment plots. The total
Phrag height in the TE Only macroplots has been reduced from a starting value
of nearly 6 feet to a present value of 3.75 feet average. Plants in the
Northwest Pool control plots are more than two times as tall averaging 8.5
feet. We do not know of any other tidal enhancement studies of this
magnitude with which to compare our data. In
The data suggests that tidal enhancement alone (TE Only) provides the same
benefits as tidal enhancement + glyphosate (TE + G) with respect to the
reduction of live culm density and height in the East Pool Phragmites populations.
Similarly, the combination of tidal enhancement + glyphosate + burning (TE + G
+ B) did not yield significantly greater reduction in density than either of
these two treatments (although a significant height reduction was
observed--most likely a consequence of burning and extended flooding with salt
water). In conclusion, the September 1998 glyphosate application did not
appear to increase the effectiveness of tidal enhancement at Phragmites growth
suppression. This data is further substantiated by our observation that tall
Phragmites stands still persist in the higher elevation islands along the
exterior margins of the East Pool--particularly along the southern edge. These
areas were targeted with aerial applications of glyphosate at 4 pts. per acre in
September 1998 (Paul Steblein, 1999- personal communication). It is possible
that application drift or inadequate dosages influenced the results of our
experiment. While glyphosate has a half life of 60 days, and is thought
to have a minimum impact on surrounding vegetation and wildlife if applied
correctly, there is mounting evidence that this herbicide may have deliterious
effects on certain fish and aquatic plant species (Krebs et al., 1999).
Moreover, Phragmites can return once the glyphosate decays since below ground
reserves are often unaffected. Finally, treatment with glyphosate is expensive,
estimated at $73 per acre (Paul Steblein, 2000--personal communication). Based
on these observations, we recommend that glyphosate applications be discontinued
in the East Pool for the period that it is maintained as a tidal salt marsh.
Tidal enhancement combined with an accidental post TE burn (TE + B) seems to
hold the greatest promise for dramatic reduction in Phrag density and height,
although a larger sample size is needed to validate these observations. The
notable absence of colonizing salt marsh plants in the two post TE + B subunits
(Macroplot 3) warrants careful evaluation of this treatment. Post TE
burning may damage young colonizing salt marsh species, converting previously
vegetated islands to barren salt flats. There may also be some advantages
to not burning dead standing biomass. Dead biomass may encourage
invertebrate populations that feed on the detritis. We observed a number of
fiddler crabs last August in the SE corner of the East Pool near macroplot K.
In addition to supporting the bird populations, the crabs dig burrows which,
according to several studies (Bertness, 1992, 1995) may help to aerate the
soil, encouraging the colonization of Spartina alterniflora, and other
salt marsh species. Stems of dead Phragmites may also help to pipe oxygen into
the soils (Tiner, 1997) hastening the decomposition process and providing
suitable conditions for colonization by desirable plant species. On the other
hand, areas densely covered by dead standing biomass may not be as readily
colonized by salt marsh species and could benefit from a prescribed burn. The
timing of the burn is critical, depending on whether active Phrag rhizomes are
present in the proposed burn area. Soil cores removed from the TE + G + B
macroplot in 2001 revealed that decomposition of the rhizomes had begun in
several of the subunits. Where actively growing rhizomes are present,
burning in the spring may actually stimulate growth of young Phragmites shoots,
due to potash enrichment from the burn. This may explain the observed
Phragmites growth spike in the summer 2000 TE + G + B plots. Consequently,
Phrag regeneration potential is still a threat in the East Pool even in the absence
of inflorescences and viable seed. Additional research is necessary to
determine if, where, and when a prescribed burn is needed in the East Pool. We
need to evaluate the recovery rate of salt marsh vegetation in post TE + B
subunits, and if possible, identify additional subunits that were subjected to
this treatment to increase the rigor of our conclusions. We also need to
determine if dead standing biomass encourages invertebrate activity, and if
relationships exist between these variables and the recovery of desirable salt
marsh vegetation in the treated macroplots of the East Pool. This is
especially important since all but the TE + B plots showed a significant
increase in total standing biomass in comparison to the East Pool pretreatment data
and to the
The East Pool has begun to shift from a system supporting brackish marsh vegetation to one supporting vegetation more typical of a salt marsh. The dominant species of the brackish marsh system including Phragmites australis, Iva frutescens, Baccharis halimifolia, and Toxicodendron radicans are being replaced by S. alterniflora S. patens, Distichlis spicata, and Sesuvium maritimum in some areas. However, due to the prolonged retention of salt water in 2001, the expected gradual change from a Phragmites dominated impoundment to a Spartina and Phragmites mixed marsh proceeded more quickly, and perhaps with some negative consequences. We expect that decomposition of dead shrubs will proceed swiftly as evidenced by their brittleness in 2001. We predict that with continued tidal enrichment, the lower elevation areas previously dominated by Phragmites and to a lesser extent by the woody shrubs will be replaced by the typical salt marsh vegetation. Higher elevation areas (although not a part of our study) should continue to support vegetation more typical of the upland transitional zone of the salt marsh featuring brackish marsh plants that formerly occupied lower elevation islands. We expect to see Phragmites in these areas as a typical component of brackish marsh vegetation. It is important to continue to monitor the macroplots to identify shifts in species composition during this critical transitional stage. We continue to recommend that a detailed vegetation map of the East Pool impoundment is prepared; this will require good aerial photos, a digitized map showing vegetation polygons, and a complete plant species inventory.
2. Changes of pH in the East Pool
It is surprising that the pore water pH ( 4 -5 ) is still relatively low even
two years following tidal enhancement. Normally tidal inundation will cause the
pH of acidic soils to increase asymptotically and stabilize around pH 6.7 - 7.2
(Ponnamparuma, 1979). Low pH may be attributed to several factors. The
contribution of fulvic and humic organic acids from the decay of the large
amount of organic debris is the main factor (Hem 1992; Armstrong et al. 1996,
Armstrong and Armstrong, 1999). The pH buffering ability at low pH by the
reaction of aluminum with hydroxyl ions may also play an important role. Other
minor factors may influence the soil pH as well. There may still be low pH
freshwater in the deep soil due to the slow drainage of the marsh (resulting
from the low hydraulic gradient of the area). Decomposition of organic
matter by aerobic bacteria and the concommitant production of dissolved
respiratory CO2 can also depress pore water pH (Ponnamparuma, 1979).
Turnover of NH4-N from leaf litter and animal wastes may also contribute to low
pH as a consequence of H+ production during nitrification. Plant roots
can compound conditions by removing cations in exchange for H+ (Ibid, 1993). If
plants selectively remove more cations (for ex., Ca++, Mg++, K+, and Na+ ) than
anions (for ex., Cl-, SO4=, NO3-, H2PO4-), then soil acidity produced by
nitrification of NH4+ will increase. Phragmites typically flourishes in
alkaline and brackish environments (Marks et al., 1994; Haslam 1972, 1971),
although there have been anecdotal citing of it in highly acidic wetlands and
mine tailings (Marks et al., 1994). Our data suggests that Phragmites
growth may be correlated with pH, but this trend was inconsistent due to
outliers and small sample size. Additional data is needed to identify the
relationship between Phragmites vigor at EBFNWR and pore water pH.
3. Changes of Salinity and Cation Concentrations in the East Pool.
Salinity is one of several factors considered important in the distribution of
Phragmites, where the most vigorous growth is favored under slightly saline or
brackish habitats (Marks et al., 1994). None-the-less, in New York state
stands of Phragmites have been observed growing in soils with salinity levels
as high as 29 ppt, and on the Red Sea coast, levels as high as 40 ppt have been
reported (Hocking et. al, 1983). The Phragmites population at EBFNWR also
appears to have a fairly high threshold of tolerance to salinity. In
summer 2001, plants were observed growing in soils with salinities ranging from
6 ppt (North Pool---Macroplot 8) to 41 ppt (East Pool--Macroplot 3), although
we detected a significant decline in vigor as salinity levels increased.
We had predicted that salinity levels above a threshold of 19 ppt would
suppress the growth of Phragmites and favor the growth of Spartina and other
species (Sun et al., 1999). However, at EBFNWR, a live Phrag density
reduction of 50% or more was acheived at 30 ppt and a similar reduction
in height around 25 ppt. Hellings and Gallagher (1992) also noted a
reduction of 50% or more in Phragmites density, height, and biomass when plants
were inundated with seawater at 30 ppt.
Cations that contribute to the salinity of sea water were also included in our
study. Our data suggests that the increase in Mg++, Na+ , and
K+ concommitant to the salinity increase may have contributed to the observed
growth reduction in Phragmites. Most research that we are aware of has
focused on NaCl as the main source of growth reduction in Phragmites. Our
regression analysis suggests that Mg++ may be even more important than Na++ in
growth suppression. Further research is needed to test the hypothesis
that magnesium salts (independent of other salts) can suppress growth in Phragmites.
The cation data is also useful for determining when and to what extent the pore
water of the East Pool macroplots reaches dynamic equilibrium with the sea
water entering the impoundment. The average pore water Na+ levels ( 9177
ppm) are less than levels reported for sea water (10760 ppm). Pore water
Mg++ levels (1228 ppm) are also less than those for sea water (1350 ppm). Pore
water K+ levels are slightly higher (417 ppm) than sea water (390 ppm), while
Ca++ levels (369 ppm) are lower than those for sea water(410 ppm). Dilution by
precipitation and exchange with plant roots will also influence the pore water
cation concentration. It is important to continue monitoring pore water
chemistry to develop a better understanding of how tidal enhancement influences
impounded marshes. Furthermore, severe drought periods and long draw
downs may result in hypersalinization which will ultimately influence
management decisions.
From both our field observation and laboratory analyses, we conclude that
the East Pool is at a critical transitional stage. Though the drastic reduction
of Phragmites is a very pleasant event, the slow colonization by other species
during the transitional phase needs to be monitored. The changes in the East
Pool are very significant in both plant type, density and hydrogeochemical
conditions. We recommend that the East Pool and control macroplots
continue to be monitored in 2002 and 2003 using the current methodology.
This monitoring should include an annual or biannual plant species inventory,
evaluation of Phragmites density and height, measurement of pore water
salinity, pH, and cation concentration, and soil profile delineation. In
addition, other recommendations have been made throughout this discussion which
are itemized below.
MANAGEMENT RECOMMENDATIONS AND DIRECTIVES FOR RESEARCH
1. Continuous tidal circulation
no extended periods of submergence with salt water.
a. is tidal circulation adequate in the interior portions of the
impoundment?
b. install piezometers along a gradient-- from water control
structures to interior.
c. identify maximum tide height and range along the gradient
2. Discontinue glyphosate applications in the East Pool/or readjust
the method.
3. No prescribed burns in the East Pool until further evaluated.
a. establish additional subunits in the macroplots for evaluating the
2000 post TE + B treatment.
b. determine if there is a positive or negative relationship
between the recovery of salt marsh vegetation and dead standing biomass
4. Monitor in August 2002 and August 2003 as follows
a. Continue to monitor post treatment Phrag growth and pore water
chemistry in existing macroplots using established methodology.
b. Estimate cover of colonizing salt marsh vegetation in all
macroplots
c . Include a more detailed survey of invertebrate populations.
Examine relationship between colonizing salt marsh vegetation and crab
activity.
5. Vegetation Map
a. aerial photos of the impoundments taken at a minimum 5000'
elevation.
b. digitize aerial photos using GIS package at
c. map vegetation polygons
6. Hydrological Budget
Measurements of both surface and groundwater flow rate and gradient of
the water slope may facilitate understanding of the hydrological system and its
effect on the ecosystem.
ACKNOWLEDGMENTS
The authors want to thank Gorge Coppen, Tracy Casselman, Amy Jones and Steve
Atzert from EBFNWR for their help with the field work, support and coordination
of the project. We want to thank Jonathan Husch who is a professor in the
Department of Geological and Marine Sciences at
REFERENCES
Armstrong, J., and Armstrong, W. 1999. Phragmites die-back: toxic effects of propionic, butyric, and caproic acids in relation to pH. New Phytologist. v142, P.201.
Armstrong, J., Armstrong, W. and Sinclair, A., 1996: Pathways of aeration and the mechanisms and beneficial effects of humidity- and Venturi-induced convections in Phragmites australis (Cav.) Trin. ex Steud. Aquatic Botany. v 54, n2 / 3 P.177
Bertness, M. D. 1992. The Ecology of a
Bertness, M.D. 1985. Fiddler crab regulation of Spartina alterniflora
production on a
Bongiorno, S.F., J.R. Trautman, T.J. Steinke, S. Kawa-Raymond and D.
Warner. 1984. A study of restoration in Pine Creek Salt Marsh,
Brown, A., and Sun, H., First Year (Winter 2000), 2000. Evaluation of Different Treatments for Controlling Phragmites in the East Pool. A special report to at EBFNWR, Brigantine, NJ.
Brown, A., and Sun, H., 1999. Draft Report for Baseline Investigation of Managing Phragmites australis in the Edwin B. Forsythe National Wildlife Refuge. A special report to at EBFNWR, Brigantine, NJ
Chambers, R. M, 1997: Porewater chemistry associated with Phragmites and
Spartina in a
Elzinga, C.L., Salzar, D.W., and J.W. Willoughby, 1998. Measuring and Monitoring Plant Populations. BLM Technical Reference 1730-1. 477 pp.
FWS. April, 1999.
Gries, C., Kappen, L. and Losch, R. 1990: Mechanism of flood tolerance in reed, Phragmites australis (Cav.) Trin. ExSteudel. The New Phytologist. v 114, n4, P.589.
Haslam, S.M. 1971. The development and establishment of young plants
of Phragmites communis Trin. Annals of
Haslam, S.M. 1972. Phragmites communis Trin. biological flora
Havens, Kirk J. Priest III, and Walter I. Berquist, Harry,
1997. Investigation and Long-Term Monitoring of Phragmites
australis within
Hellings, S.E. and Gallagher, J.L., 1992. The effects of salinity and flooding on Phragmites australis. The Journal of Applied Ecology. v 29, n1, P.41
Hem, J.D. (1992) Study and Interpretation of the Chemical Characteristics of
Natural Water. 3rd Ed. United States Geological Survey Water Supply
Paper 2254.
Hood, L. 1998. Science-Based Stewardship: Recommendations for
Implementing the National Wildlife Refuge System Improvement Act.
Defenders of Wildlife Handbook. 1101
Kerbs, J.,
Langmuir, D. 1997. Aquatic Environmental Geochemistry.
Prentice Hall, Inc.
Lissner, J., and Schierup, H.-H., 1997: Effects of salinity on the growth of Phragmites australis. Aquatic Botany., v 55, n4, 247
Marks, M., Lapin, B. and Randall, J., 1994: Phragmites australis (P. communis): Threats, Management, and Monitoring. Natural Areas Journal. v 14, n4, P.285
Mckee, Juno, and Richards, A.J., Variation in seed production and
germinability in common reed (Phragmites australis) in
Neuhaus, D., Kuhl, H. and Kohl, J. G., 1993: Investigation on the genetic diversity of Phragmites stands using genomic fingerprinting. Aquatic Botany. v 45, n4. P.357
Ponnamperuma, F.N. (1979) The chemistry of submerged soils. Adv. Agron, 24, 29-96.
Roman, C.T., W.A.Niering, and R.S. Warren. 1984. Salt marsh vegetation change in response to tidal restriction. Environmental Management 8:141 150.
Sun, H., Browne, K. and Husch, J., 1998: Pore water geochemistry in a
transition zone of Spartina to Phragmites in a tidal marsh in
Templer, Pamela,
Thompson, D.J. and Shay, J. M., 1989: First-year response of a Phragmites marsh community to seasonal burning. Canadian Journal of Botany. v 67, , n5, P.1448
Tiner, R. May, 1997. Managing Common Reed (Phragmites australis) in Massachusetts- an overview of the Species and Control Techniques. Mass. Wetlands Restoration and Banking Program. Executive Office of Environmental Affairs. 100 Cambridge St., Boston, MA 02202.
Tisdale, S.L., W.L. Nelsen, J.D. Beaton, and J.L. Havlin. 1993. Soil Fertility and Fertilizers. 5th Ed. Macmillan Publ. Co., New York. P. 365
Tucker, G.C. 1990. The general of Arundinoideae (Gramineae) in the southeastern United States. Journal of Arnold Arboretum 71: 145-177.
Windham, L. and Lathrop, Richard G. Jr. 1999. Effects of Phragmites australis (Common Reed) invasion on aboveground biomass and soil properties in a brackish tidal marsh of the Mullica River, New Jersey. Estuaries. V. 22, n4 P. 927
Zar, J.H. (1984) Biostatistical Analysis. Prentice Hall, New Jersey
[Project HomePage], [Rider University ] [EBF Wildlife Refuge]
[Suggestions/Comments][Go
to the top of the page]