Will
Every Drop of Water in the Delaware River Turn Salty?
Protect our WATER in THE DElaware RIVER
dR. hONGBING sUN
Department
of Geological, Environmental, and Marine Sciences, Rider University, New Jersey

THE DELAWARE RIVER
WATERSHED
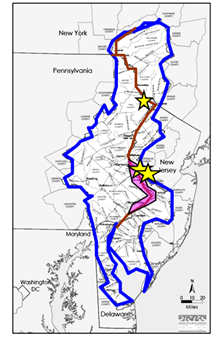
The Delaware River Watershed is located across 5 states: New York, Pennsylvania, New Jersey, Delaware, and Maryland. It has a catchment area of 13611 square miles and roughly 8.7 million residents according to the 2010 US Census data. There are approximately 15 million people depending on the river for their drinking water.
However, the
Delaware River Watershed has a very dense road network due to its population
and intense economic activities in the region. Therefore, it is also one of the
large watersheds that have the most winter deicing salt applied per square miles
in the US.
THE DELAWARE RIVER IS GETTING SALTY
The Salty Facts
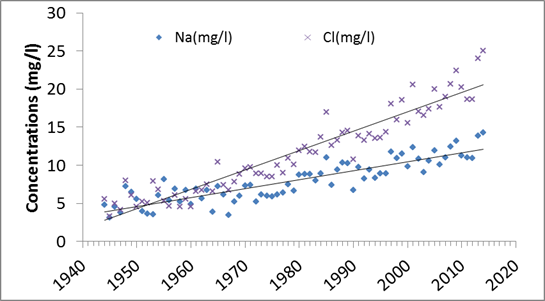
Between 1945 and 2018, sodium concentration in the Delaware
River at Trenton increased 4 times and chloride concentration increased 6.3 times.
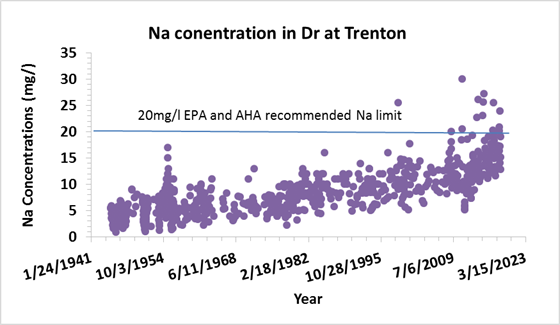
There were 14 periods on the record in the Delaware River at Trenton that
sodium concentrations was above the 20 mg/l limit recommended by US
Environmental Protection Agency and America Heart Association. 13 of these
periods were recorded between 2008 and 2018.
|
Annual
average sodium and chloride concentration trends from 1945 to 2014 at Trenton
Station
|
13 of the 14 periods that sodium concentration was
above 20 mg/l were recorded between 2008 and 2018 at Trenton Station
|
|
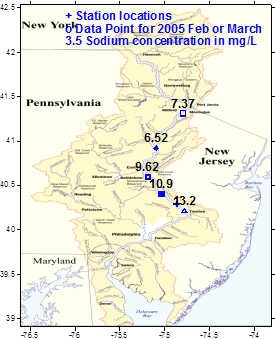
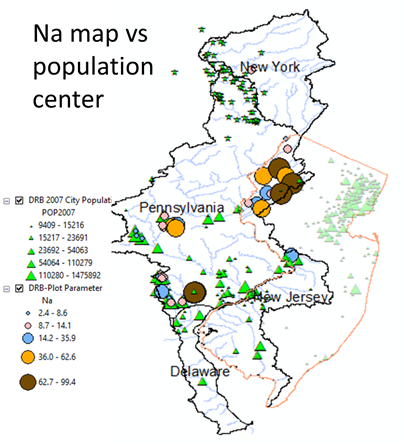
Sodium concentrations increased downstream because of the
salt runoff (2005 data)
|
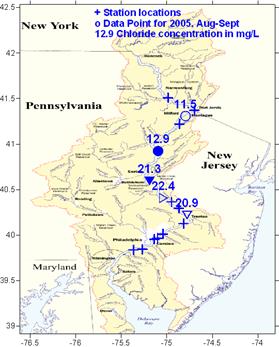
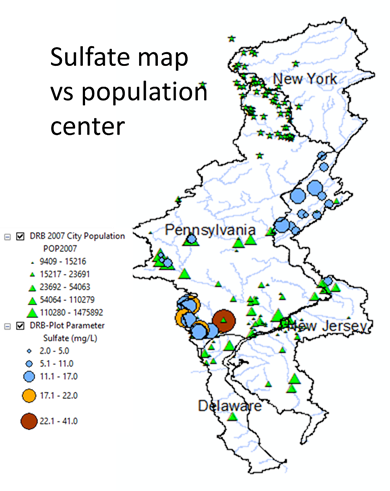
Chloride concentrations increased downstream as well (2005
data)
|
My Projection
By year 2070 or
sooner, average annual sodium concentration in the Delaware River at Trenton
will reach the 20 mg/l EPA and AHA recommended limit. By the end of the
century, the average annual sodium concentration will be about 25 mg/l, well
above the 20mg/l benchmark. Sodium concentration at the intake points of
Philadelphia Water Department will reach this 20 mg/l benchmark sooner than
at the Trenton gauging station. Upstream stations might reach this benchmark of
20mg/l a little later. Between now and 2070, there will be more periods in
January and February in which sodium concentrations will be above 20 mg/l.
|
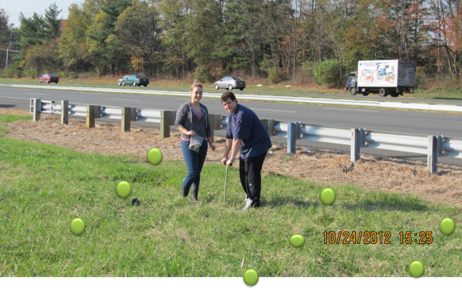
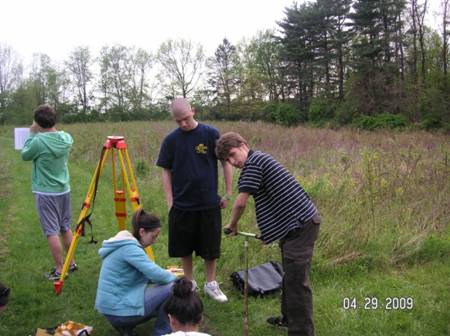
a. Brita Gove and Eric Pezzi Collecting Soil Samples
next to Interstate Highway 95 to Examine the Salt Retention in 2012.
|
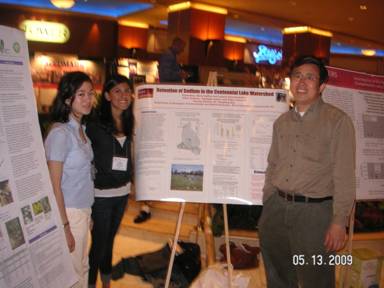
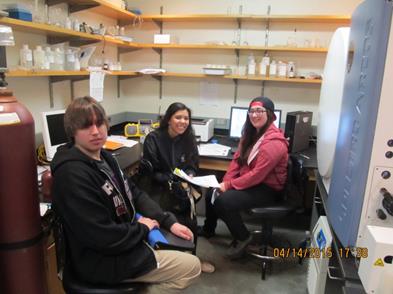
Maria Huffine, Leeann Sinpatanasakul (with Dr. Sun)
Presenting Their Salt Project at America Water Work Association Annual
Conference in2009. The presentation won the frist place undergraduate award.
|
|
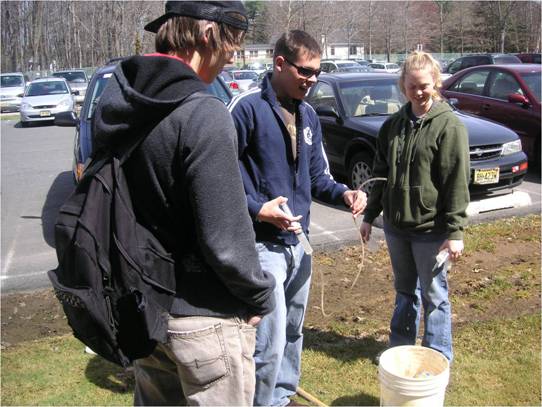
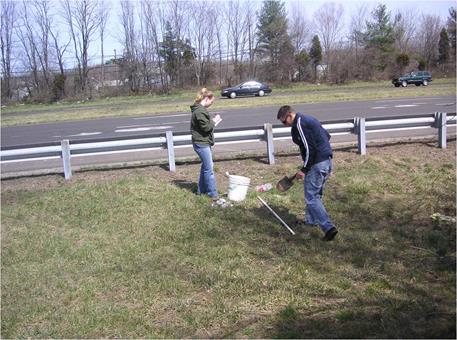
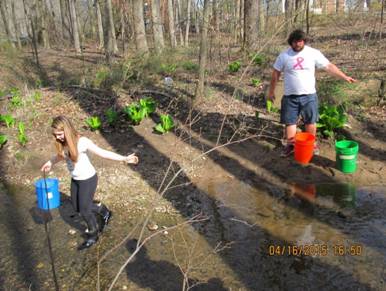
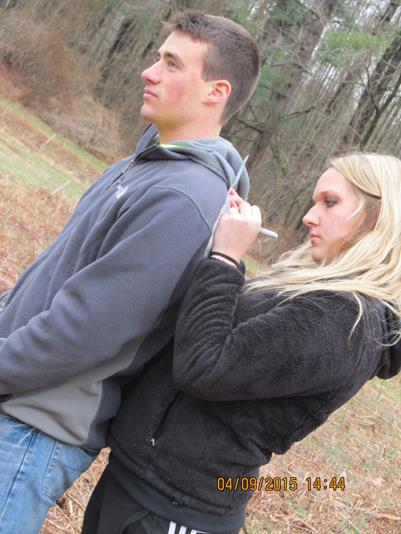
Daniel Carlson, Matthew Nelson, and Kelly Luckarino
Collecting Post Salting Water Samples from the Runoff Cup near a Parking Lot
at Rider University.
|
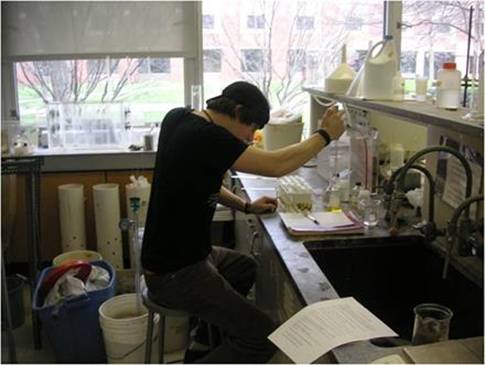
Daniel Carlson Doing a Titration of Chloride with
Silver Nitrate at Rider University Science and Technology Center.
|
|
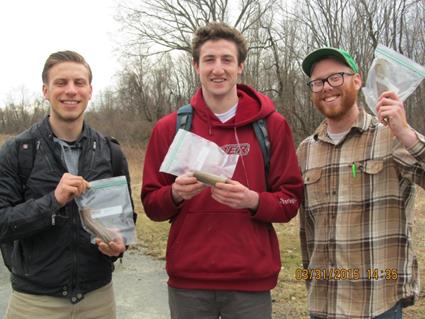
Soil Sampling Crews: Nick, Alex; Bottom: Kelly and Matt
sampling the soil properties and salt retention in soils.
|
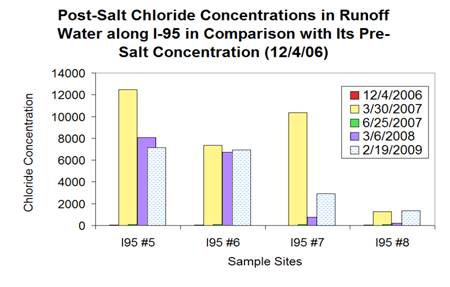
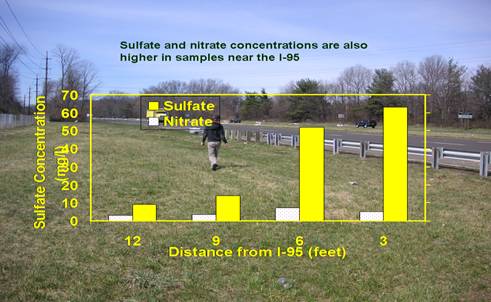
Top:Sodium chloride concentrations can be hundreds
times higher in post salting runoff water than in that of pre-salting runoff
water. Bottom: Sulfate and nitrate concentration also shows a increasing
trend towards the highway in runoff water.
|
|
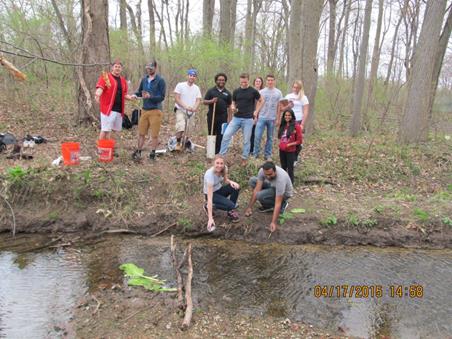
Water sampling and insitu pH, temperature and conductivity
measurement at Little Shabakunk Creek watershed, NJ (Front: Rachel,Muhammad
and Suvarna. Back from left: Brian, Alex, Geoffrey, Paul, Norbert, Jessica,
Craig, and Haley)
|
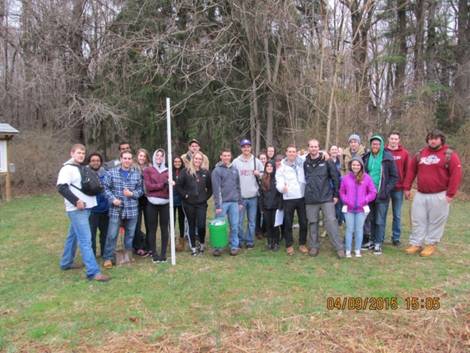
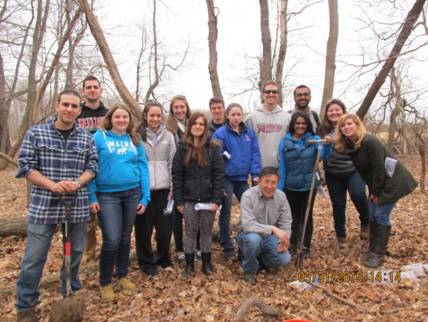
Soil field survey and sampling crews at Drexel
Woods (2015 soil class).
|
WHAT IS THE HARM OF TOO
MUCH SODIUM?
According to American
Heart Association Web site
Quote: Excess levels of sodium/salt may put you at risk for:
Your Health
- High
Blood Pressure
- Stroke
- Heart
Failure
- Osteoperosis
- Stomach Cancer
- Kidney
Disease
- Kidney Stones
- Enlarged
Heart Muscle
- Headaches
Your Appearance
Excess levels of sodium may cause:
Increased Water Retention, Leading To
- Puffiness
- Bloating
- Weight Gain
End Quote. See AHA web site for more
information
WHO IS PUTTING SALTS INTO
THE DELAWARE RIVER WATERSHED?
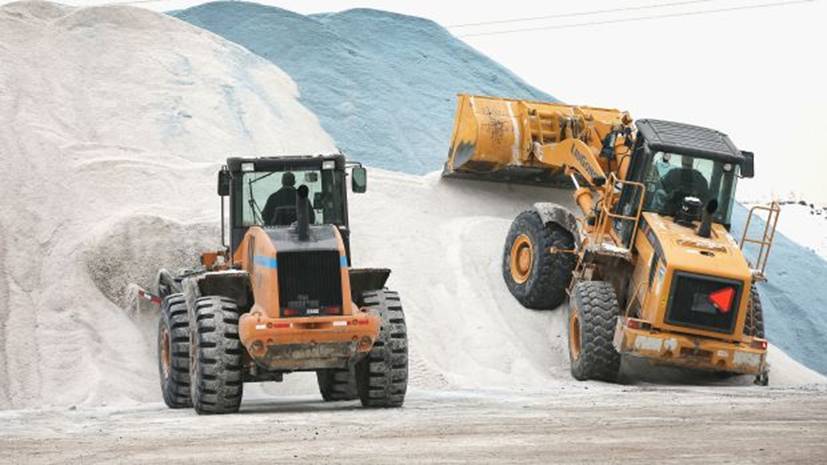 CBS
Photo (Credit: Scott Olson/Getty Images).
CBS
Photo (Credit: Scott Olson/Getty Images).
The largest
salt source is the winter deicing salt. The contribution of its proportion
increases annually. Currently, deicing salt contributes to about 2/3 of the
total sodium input in the Delaware River. Technical details about this
estimation can be found in two of my research articles published in Journal of
Contaminant Hydrology and Applied Geochemistry (Sun et al., 2012,and Sun et al., 2014)
|
Proportional
change of Na+K in the Delaware River at Trenton since 1944 (Source: Sun et al., 2014) |
Proportion
change of Cl in the Delaware River at Trenton since 1944(Source: Sun et al., 2014) |
|
|
|
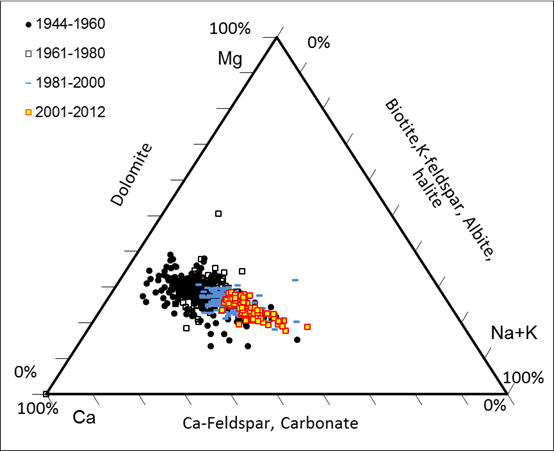
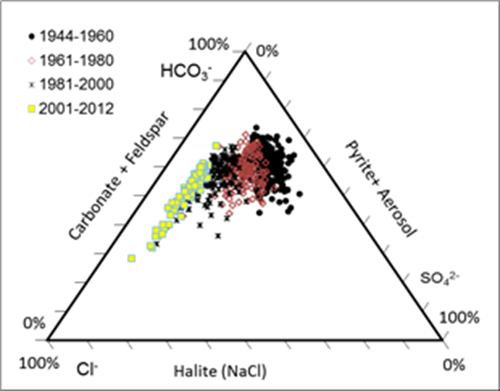
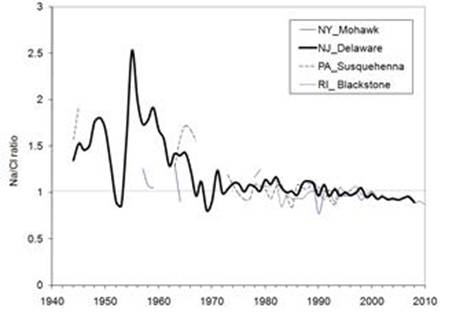
Before the
large application of road deicing salt (1940-1950th), sodium in the
Delaware River came mainly from the weathering of albite and other minerals.
Na/Cl molar ratios in the Delaware River were between 1 and 3. With increased
supply of the sodium chloride from deicing salt at a Na/Cl molar ratio of 1:1,
and overall high sodium retention than chloride due to high affinity of sodium
to the negatively charged particles in nature, Na/Cl molar ratios started to
decline. Based upon the Na/Cl molar ratios in the Delaware River and Na/Cl
molar ratio model we established from salt injection experiments in the lab, we
can estimate the source partition of sodium chloride in the Delaware River.
|
Decline
of Na/Cl molar ratios due to the increased supply of deicing salt |
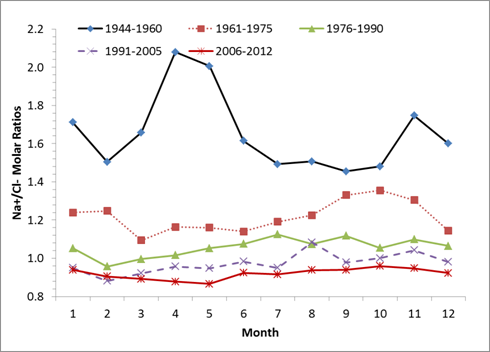
Seasonal
Change of Na/Cl molar ratios since 1944 |
|
|
|
2). Weathering Supply from Nature
Our
estimation is that currently sodium supply from natural weathering in the
Delaware River is less than 15% of the sodium. Because surficial geology of the
Delaware River Watershed is mainly sedimentary rock, little natural salts
remain. The main sources of natural sodium are albite, a kind of feldspar, and
various clay particles and organic matters that have sodium absorbed onto.
3). Agriculture Fertilizer
Contribution
of salt from the agriculture sources might be significant before the road salt
becomes dominant. However, it is unlikely that the agriculture fertilizer is a
reason for the sodium and chloride increase in the Delaware River Watershed (DRW).
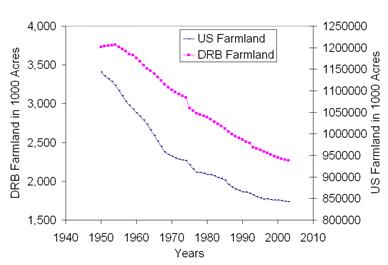
Between 1950 and 2004, the farmland in the Delaware River Watershed was reduced
by 47.6%, while the national
farmland was reduced only by 22.1% during the same period.
|
Reduction of the farmland in DRW was
almost twice as faster as the national average (Source: Sun et al., 2006)
|
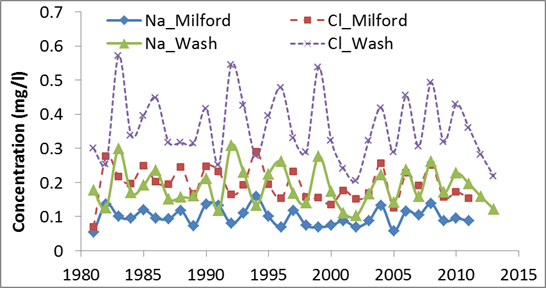
4). Precipitation
Precipitation accounts for less than 4% of sodium chloride in
the Delaware River (see the underneath Table). Its contribution has not changed
significantly based upon the available data between 1983 and 2013.
|
No significant trend
for sodium and chloride concentrations in the precipiation at two stations in
the DRW. Data Source (National
Atmonspheric Deposition Program)
|
Locations of three
precipitation stations in the DRW. Top, Milford, PA; bottom two, Washington
Crossing and Princeton, NJ
|
 5). Discharge from Water Treatment Plants
Sodium level in recycled water can be twice the sodium level
in potable water. The salt here mainly comes from the salt in the food, water
softener, disinfectants (sodium hypochlorite), etc. Salt proportion in this
category increased over the years mainly due to the population increase. There
were about 5.08 million people in Delaware River Watershed back in 1950. By
2010, there were about 8.7 million people. This can account for 3-4 % of the
total sodium in the Delaware River Watershed.
IMPACT OF INCREASED DEICING
SALT ON OVERALL WATER QUALITY IN THE DELAWARE RIVER
1). Water Is Getting Salty
Between 1945 and 2018, sodium
concentration in the Delaware River at Trenton increased 4 times and chloride
concentration increased 6.3 times. The increasing trends of sodium and chloride
concentrations will likely continue in the foreseeable future due to sodium and
chloride retention in the soil (Sun et al., 2012).The projection is that by
year 2070, the average annual sodium concentration in the Delaware River at Trenton
will reach the 20 mg/l EPA and AHA recommended limit. Sodium concentration
at the intake points of Philadelphia Water Department will reach this 20
mg/l benchmark sooner than at the Trenton gauging station.
2). Water Is Getting
Harder
The underneath table shows the normalized 10-year
average annual concentrations and regression trends of major ions, pH, and
charge ratios in precipitation at Milford station, PA and Washing Crossing
station, NJ, and in the Delaware River at Trenton, NJ station (Sun et al., 2014).
Statistically significant upward trends can be identified for both calcium and
chloride concentrations between 1944 and 2013 in the Delaware River. Trends for
concentrations of other elements can be identified as well. Not all the trends
are due to the cation exchange of sodium with other cations or the anion
exchange/complexation of chloride with other ions.
Units:
Kg/hectare/year.
|
|
SiO2 |
Ca2+ |
Mg2+ |
Na+ |
K+ |
HCO3- |
SO42- |
Cl- |
NO3- |
pH |
Z+/Z- |
|
Milford, PA
(precipitation) |
|
||||||||||
|
1981-1990 |
--- |
0.88 |
0.27 |
1.12 |
0.26 |
--- |
24.54 |
2.33 |
17.74 |
4.29 |
0.92 |
|
1991-2000 |
|
0.84 |
0.22 |
1.27 |
0.20 |
--- |
21.89 |
2.43 |
18.04 |
4.35 |
0.95 |
|
2001-2010 |
--- |
0.94 |
0.23 |
1.24 |
0.31 |
--- |
16.37 |
2.42 |
13.95 |
4.54 |
1.00 |
|
Washington Crossing, NJ
(precipitation) |
|||||||||||
|
1981-1990 |
--- |
1.25 |
0.47 |
2.09 |
0.29 |
--- |
25.43 |
4.12 |
15.79 |
4.33 |
0.93 |
|
1991-2000 |
--- |
0.83 |
0.37 |
2.26 |
0.24 |
--- |
21.25 |
4.28 |
15.60 |
4.38 |
0.95 |
|
2001-2010 |
--- |
1.01 |
0.34 |
2.13 |
0.24 |
--- |
18.59 |
4.12 |
13.50 |
4.50 |
0.99 |
|
Delaware River at Trenton (n=695, basin area, 17560
square kilometers, downstream) |
|||||||||||
|
1944-1950 |
10.91 |
90.16 |
30.39 |
31.46 |
8.60 |
245.68 |
149.28 |
31.68 |
8.06 |
7.03 |
1.01 |
|
1951-1960 |
12.60 |
91.61 |
31.10 |
32.68 |
9.54 |
255.18 |
151.05 |
36.16 |
7.98 |
7.10 |
0.99 |
|
1961-1970 |
7.33 |
63.82 |
22.08 |
25.73 |
6.26 |
166.78 |
107.32 |
35.79 |
7.64 |
7.12 |
1.00 |
|
1971-1980 |
9.40 |
107.85 |
36.55 |
46.27 |
11.78 |
304.15 |
156.62 |
67.06 |
15.25 |
7.92 |
1.02 |
|
1981-1990 |
8.23 |
94.26 |
32.89 |
50.83 |
7.91 |
125.56 |
75.11 |
9.45 |
8.00 |
||
|
1991-2000 |
8.71 |
89.38 |
29.87 |
56.82 |
7.96 |
279.67 |
99.83 |
88.10 |
9.08 |
7.88 |
1.02 |
|
2001-2011 |
11.10 |
115.07 |
38.11 |
84.84 |
9.91 |
366.67 |
108.09 |
143.10 |
10.46 |
7.86 |
1.02 |
|
Regression Trends of Ion
Concentrations in the Delaware River at Trenton between 1944 and 2012. For SO42-,
between 1980-2012 |
|||||||||||
|
Regression t-test |
-7.29 |
4.09 |
3.73 |
25.61 |
-2.92 |
6.04 |
-12.55 |
34.30 |
4.57 |
18.34 |
--- |
|
Data number used |
690 |
694 |
694 |
693 |
466 |
536 |
231 |
694 |
565 |
693 |
--- |
|
Average Annual Ion Precipitation as Percentage of Delaware River
Ion Discharge at Trenton |
|||||||||||
|
1981-1990 |
1.1% |
1.1% |
3.2% |
3.5% |
--- |
19.9% |
4.3% |
177.3% |
53.9% |
--- |
|
|
1990-2000 |
0.9% |
1.0% |
3.1% |
2.8% |
--- |
21.6% |
3.8% |
185.1% |
55.5% |
--- |
|
|
2001-2010 |
0.8% |
0.7% |
2.0% |
2.8% |
--- |
16.2% |
2.3% |
131.2% |
57.6% |
--- |
|
|
*Precipitation data are from NADP
and stream data are from the US Geological Survey. Z+/Z-
is the positive to negative charge ratio and n is the sample size. Regression
t-test is for the regression slope of concentration vs. sample date. Any t
value >1.97 or <-1.97 indicates a significant trend with 95%
confidence. A positive t value indicates an increasing trend while a negative
t value indicates a decreasing trend. The higher the t value is, the stronger
the trend is. |
|||||||||||
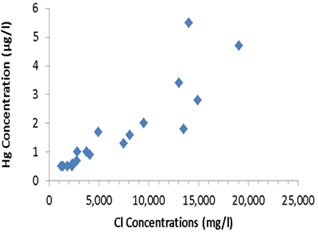
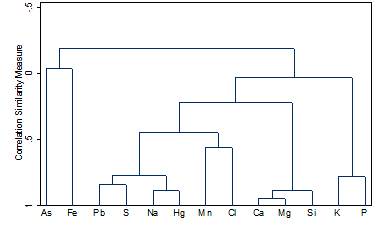
3). More Heavy Metals Are Released
Complexation of chloride with lead and mercury can lead to their
increased release into the soil solution and river water. Dispersion from
hydrated sodium can also lead to the increased concentration of arsenic in soil
solution.
|
When Cl concentration increases, Hg release increases as well. Data are from a coastal aquifer in Italy published by Grassi and Netti (2000). (Sun et al., 2015) |
Positive concentration correlation between Na, Hg, Cl, and Pb from the Centennial Lake Watershed in the DRW (Sun et al., 2015). |
|
|
|
WHAT CAN WE DO?
Alternative Salt: Calcium Chloride for Deicing?
Since calcium is a macronutrient element in soil and water
and maybe beneficial to organisms in moderate amount, it can be taken up by
organisms in soil easily. Calcium salt also might help neutralize acidity in
soil and water from acid rain to some degree (unless plants prefer acidic
soil). Therefore, calcium chloride (CaCl2) can be used as an alternative salt
in place of sodium chloride for deicing. However, because calcium has a higher
cation exchange capacity than sodium, initially it will accelerate the release
of sodium that was stored in soil from the application of sodium chloride salt
in the past few decades. We will not expect a decrease in the concentration of
sodium in the Delaware River for many years to come, even if we switched all
the deicing salt to the calcium chloride. In addition, strong cation exchange
capacity of the calcium might accelerate the release of other unwanted metals
from soils locally when there is an elevated source of a particular metal. Also
too much calcium and magnesium might increase
the hardness of water. Fortunately, most heavy metals have a relatively
short travel distance in surface water due to their strong adsorption by soil
colloids. Also, river water in the Delaware River has a moderate hardness which
is difficult to change due to the active nature of calcium with soil and
organisms. More studies are needed on this.
|
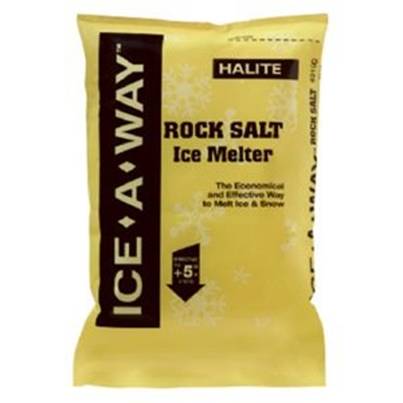
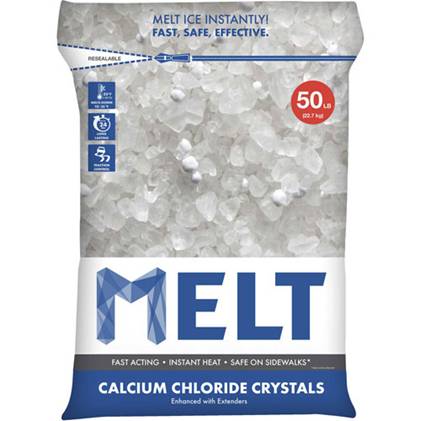
Deicing Salt
Choice: Sodium Chloride or Calcium Choride? |
|
|
Sodium Chloride (also called
halite, NaCl) Cost: $7-to $10 per 50lbs. Melt down to 5oF Less eco-friendly |
Calcium Chloride (CaCl2),
Cost: $20 to $25 per 50lbs Melt down to -25oF More eco-friendly |
|
|
|
|
EPA recommended sodium
level in drinking water: 20 mg/l. |
EPA recommended calcium level
in drinking water __none(?) |
|
Our vote goes to calcium chloride for now. |
|
Recent Activities
1. Water quality and salt
concentration study of Shabakunk Creek Watershed in NJ
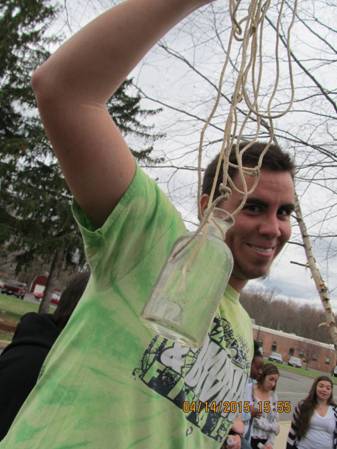
Underneath pictures show students
of different classes from Rider University involved in field water sampling,
laboratory analyses of nitrate, phosphate, ICP analyses of salt (Na, and Cl)
and soil survey and quality study (picture showing the PVC pipe) survey.
|
Sebastian Oberndorfer
and students from GEO-102L are collecting water samples in the Centnnial Lake
watershed from a small bridge |
|
|
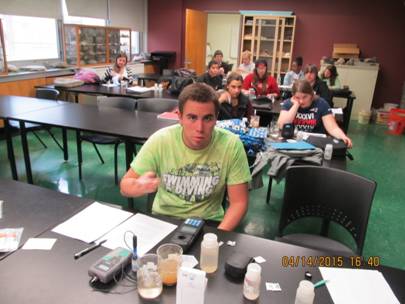
Measuring, pH, temperature,nitrate,
and phosphate concentrations of collected water samples with a pH meter and
colorimeter. Front two rows are Sebastian Oberndorfer, Kelly Weeks and
Julie Koval. |
Brian Corino, Nicole
Tyburczy, and Samantha Watkins are measuring metal and halogen elemental
concentrations of collected water samples using ICP at Science and Technology
Center of Rider University. |
|
Kelly Catino, Imani Guest,
and Andrea Cavalluzzi are measuring metal and halogen elemental
concentrations of collected water samples using ICP at Science and Technology
Center of Rider University. |
Samantha Watkins, Brian
Corin, Michael Sammartino, and Nicole
Tyburczy are measuring stream discharge with a flow meter.
|
|
Gathering water from
Shabakunk Creek for soil percolation study (Ambria and George) |
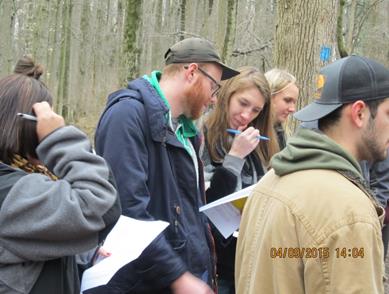
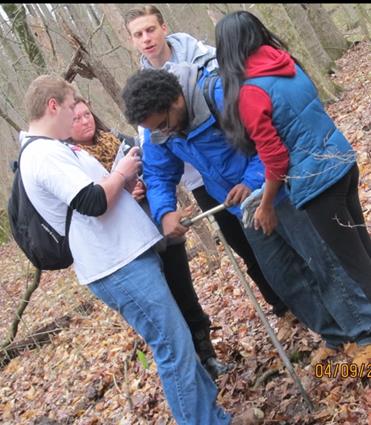
Taking notes in a soil
field survey trip (Rebecca, Steve, Rachel, Haley, and Alex). |
|
Collecting water samples
from a suction lysimeters to study soil solution and analyze the sources of
water chemistry in the Shabakunk Creek (Dave, Kathy, Gregory and Dr. Sun) |
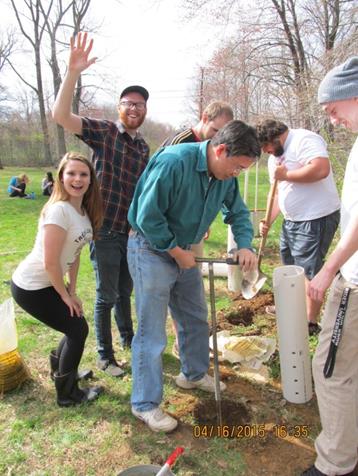
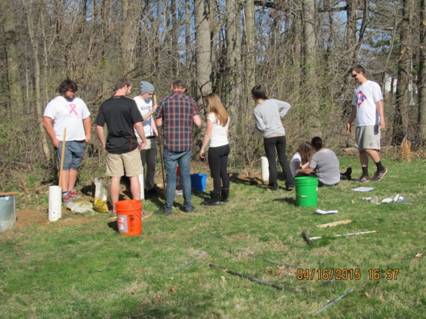
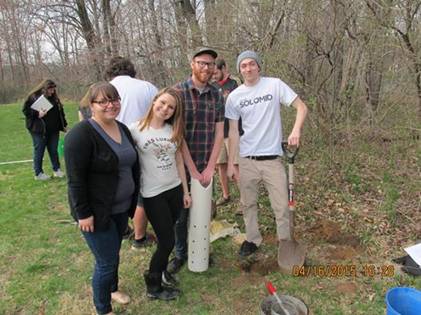
Digging holes with a hand
auger for soil percolation-groundwater flow study near Shabakunk Creek (Ambria,
Steve, Ian, George, Dr. Sun and Gregory).
|
|
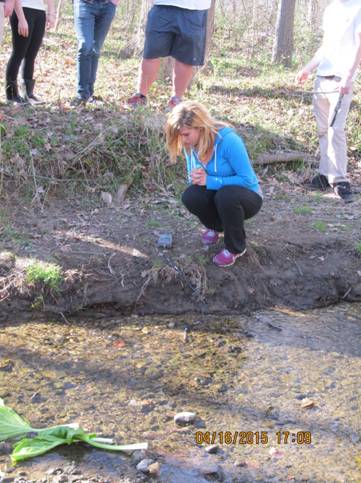
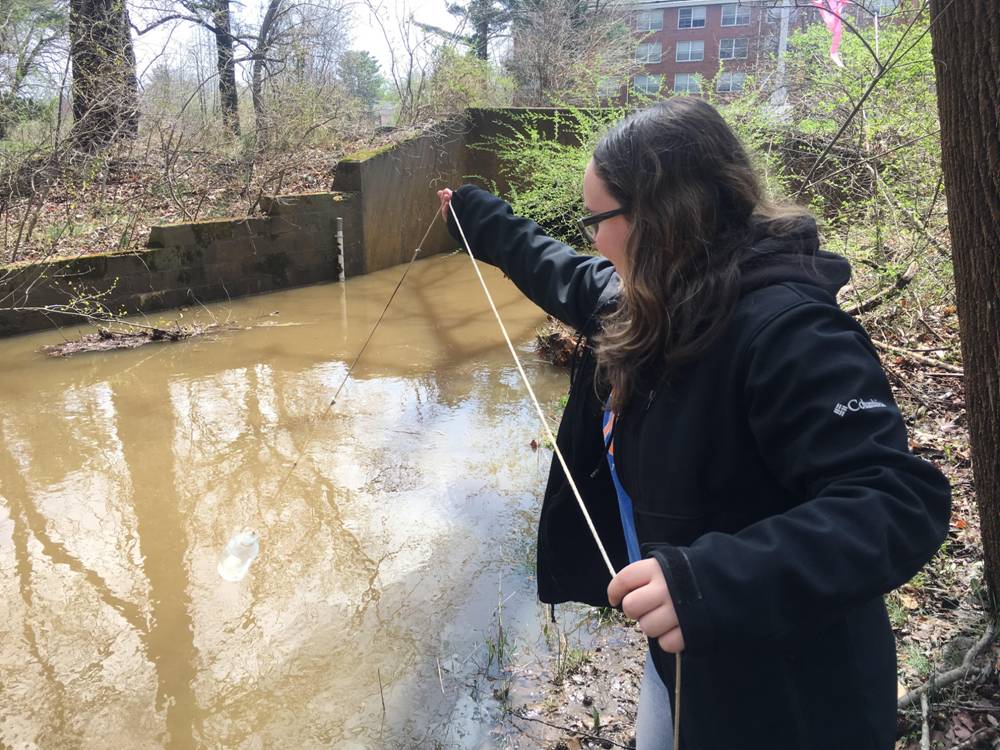
Rider senior (Elaine) is conducting a in-situ pH and
conductivty measurement of water in the Shabakunk Creek. |
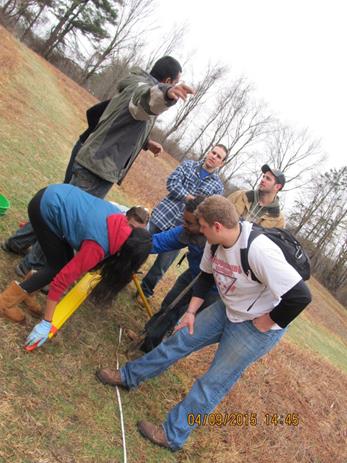
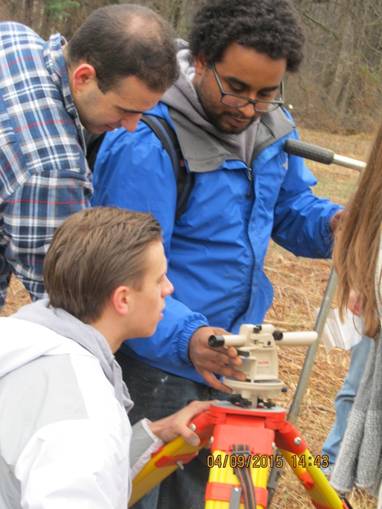
Aiming at the measuring rod
from a soil survey level (Muhammad, Geoffrey, Alex(back), Rebecca, Norbert,
Paul and Brian).
|
|
Collecting soil samples in
Drexel Woods, Lawrenceville, NJ (Brian, Rebecca, Paul, Norbert,Suvarna) |
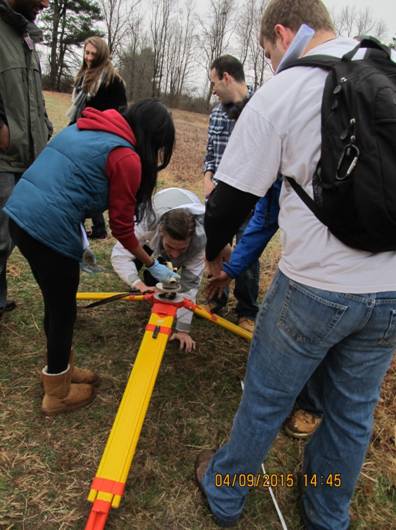
Aiming at the measuring rod
from a soil survey level (Geoffrey, Paul and Norbert).
|
|
Creative use of a flat
panel for taking field notes (Craig and Haley)
|
Norbert is really having fun
with the survey level.
|
|
Sections of soil monolith
colelcted from Mercer field, New Jersey (Norbert, Sam and Steve)
|
Soil percolation study at
the edge of Shabakunk Creek, New Jersey
|
|
Group A of soil survey
crews in Mercer Field Park: Geoffrey, Alex, Kelly, Dianna, Rachel, Katharine,
Norbert, Caitlyn H., Dave, Suvarna, Muhammad, Caitlyn, Elaine
|
Percolation test crews
(front): Kathy B., Ambria, Steve, Gregory
|


 .
.
2. Water samples from tributaries of the
Delaware River by volunteers of the Delaware RiverKeeper Network, Musconetcong Watershed Association, and
Stroud Water Research Center are being collected and analyzed at Rider
University Science and Technology Center.
|
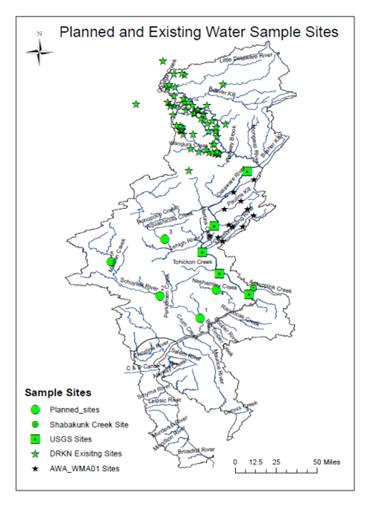
Planned and
existing water sample locations sampled in collaboration with Delaware
RiverKeeper Network for salt analyses. Locations are mainly in northern
branches of Delawa |
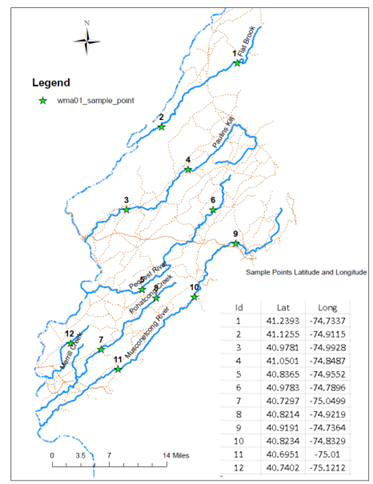
Currently sampling locations in collaboratory with Musconetcong Watershed Association, NJ
|
|
Average Na Concentration (mg/l) of 2016 spring data
|
Average sulfate concentration(mg/l) of 2016 spring data |
Student
presentation of salt data from large DRB in 2018 Fall.
Student presentation of salt
data from large DRB in 2016 spring.
Taylor Grieshaber was taking water
samples from a creek at Rider in fall, 2018.
3. Studies of salt
intake and public health issues (Updated 2/9/2019)
1). Increased salt
intake and hypertension
Disclaim: this is only the opinion of
the author. They do not represent the opinion of any organizations. If you have
questions regarding the salt and your health, please consult with your
physician.
(Most lines are directly cited from
Sun and Sun, 2018,
Journal of the American Society of Hypertension. Vol 12, No. 5, p. 392-401)
The broad consensus
is that increased sodium intake is positively associated with blood pressure.
Increasing dietary sodium intake is generally believed to result in expansion
of blood volume and increase in blood pressure. This is particular an issue for
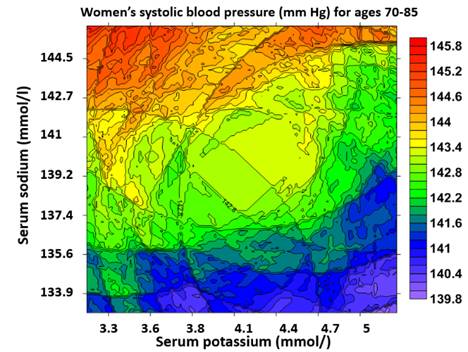
seniors-roughly
ages 60 and above for men and 70 and above for women because our systolic blood
pressure increases with age (See underneath figure). Diastolic blood pressure
increases with age before 50 and decreases afterwards for both men and women.
These trends reflect the progressive stiffness of large elastic arteries in
cardiothoracic circulation and slow narrowing of blood vessels with age.
Progressively decreasing glomerular filtration rate, reducing renal flow rate
and increasing blood osmolality with age also contribute to increased blood
pressure in advanced ages. Therefore, the seniors and people with hypertension
are probably the most salt sensitive groups that will be affected the most when
salt level in water rises. Drinking water in the tri-state region (NY, NJ and
PA) is mainly from the Delaware River.
|
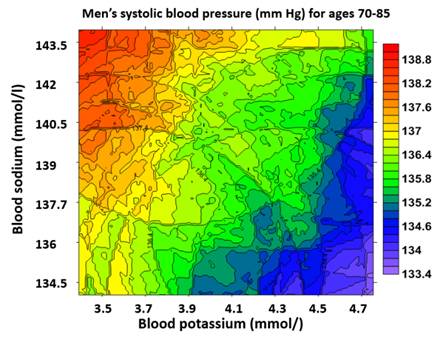
Iso-systolic blood pressure (mm of Hg) maps of
blood (serum) sodium and potassium for men
ages between 70 and 85. Note that increased serum sodium generally
increase the blood pressure (Sun and Sun., 2018, Journal
of the American Society of Hypertension, vol12, No5, p.392-401. Figure
3a-b). Though salt intake is not the same as serum sodium, at certain sodium
intake level, increase of sodium intake will increase the serum sodium. This
will be more apparent for people in advanced ages (for more specific, see my
original journal article).
|
|
|
Age averaged trends of systolic (low left,)and diastolic blood pressures
23826 women between ages 12 and 85 in the US population- systolic blood
pressure increases with age (Sun and Sun, 2018, Journal of the
American Society of Hypertension, vol12, No5, p.392-401. Figure 3a-b).
|
|
2). Increased salt intake and possible
links to multiple sclerosis progression (under study)
Multiple previous studies have linked high
sodium intake to progression of multiple sclerosis. High-sodium chloride
concentrations have been reported to induce the production of Th17 cells by
upregulating the production of pro-inflammatory cytokines GM-CSF, TNFα,
IL-2, IL-9, several chemokines and CCR6 which are essential for the autoimmune
function of Th17 cells. Overreact of autoimmune Th17 cells can cause rapid
increase of autoimmune diseases. Studies also suggested that high sodium influx
through the voltage gated sodium channel can induce cell damage. Sustained
sodium influx can trigger calcium ion influx, which produces axonal injury in
neuroinflammatory disorders such as multiple sclerosis. (Opinions of
the following articles: Binger KJ, Linker RA, Muller DN, Kleinewietfeld M.
Sodium chloride, SGK1, and Th17 activation. Pflugers Archiv- Eur J Appl
Physiol. 2015;467:543-50; Zostawa J, Adamczyk J, Sowa P, Adamczyk-Sowa M. The
influence of sodium on pathophysiology of multiple sclerosis. Neurol Sci.
2017;38:389-98).
Though there is a population study argued against the above idea, the author here suspects an error existing in that study for their dietary estimation of the population sodium intake. Sodium intake can be significantly different if a person/s dietary items are from different locations even if they are the same items. For example, a potato from one state can have significantly different amount of sodium than a potato from another state. Sodium levels in crops reflect the sodium levels in soil (see the underneath figure from Sun, 2018 Environmental Geochemistry and Health, 40:1513-1524). One needs to track the sources of dietary item in a population study for an accurate estimation of sodium intake which is difficult to achieve. Sodium limitation in soil does not affect plant growth as much as macronutrients. More studies are needed on this.
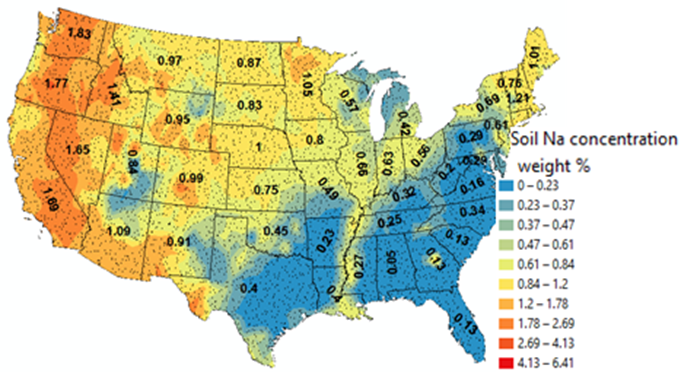
The above figure is the soil sodium
distribution measured in the US from 4856 sites across all 48 states between
2007 and 2010 by USGS. Soil sodium concentrations are directly linked to the
sodium level in crops and they change from location to location (The figure is
from Sun, 2018. Environmental Geochemistry and
Health. 40:1513-1524).
News Link
Where does the road salt go? Channel 6-abc news 2/6/2019.
Where will all that road salt go? Into the Delaware River - and that's a concern? Philadelphia Inquirer story: Salt good for roads, bad for environment (1/11, 2018).
CNBC story: Road salt: The winter' s $2.3 billion game changer (2015).
PennDot
used 831,000 tons of salt on average for the last five winters before 2013.
b. It used 1.12 million tons in 2013-2014 winter (by 3/2014).
SALT PROJECT RELATED PUBLICATIONS
1. Sun, H., Grieshaber, T., Sulaman F., Margel L., Panuccio, E.
and Lawler N., 2018. Salty Water Trend and Sources
of Salt in the Delaware River. In Water supply, hydrology and hydrodynamics in
New Jersey and the Delaware River Basin. 2018 Conference Proceedings for the 35thAnnual Meeting of
the Geological Association of New Jersey.
2. Sun, H. and M Sun. 2018. Age
and gender dependent associations of blood pressure and serum sodium and
potassium,Renal and extrarenal regulations. Journal
of the American Society of Hypertension. Vol 12, No. 5, p. 392-401. High serum sodium may be
related to increasing blood pressure in seniors. For an exact word file, you
can download by clicking here.
3. Sun, H. 2018. Association of soil potassium
and sodium concentrations with spatial disparities of prevalence and mortality
rates of hypertensive diseases in the USA. Environmental Geochemistry and Health 40:1513–1524. Increased sodium in
drinking water is a complicated issue. It may not be a problem for young
people. But for people of advanced ages, increased salt might be an issue
related to increased hypertension.
4. Sun, H., Alexander,
J., Gove, B., Koch, 2015. Mobilization
of arsenic, lead, and mercury under conditions of sea water intrusion and road
deicing salt application. Journal of Contaminant Hydrology. In Review.
5. Sun, H.,
Alexander, J. Gove, B., Pezzi, E., Chakowski, N., Husch, J., 2014. Mineralogical and Anthropogenic
Controls of Stream Water Chemistry in Salted Watersheds.
Applied
Geochemistry. 48(214) p.141-154.
6. Sun, H.,
L. Sinpatanasakul,. J.M. Husch, M. Huffine, 2012. Na/Cl molar ratio changes during a
salting cycle and its application to the estimation of sodium retention in
salted watersheds. Journal of Contaminant Hydrology.136-137, p. 96-105
7. Sun, H.,
Lucarino, K., Huffine, M., Husch J.M., 2010. Retention of Sodium in a
Watershed due to the Application of Winter Deicing Salt. Proceeding paper
of the joint session of the 10th International Symposium on Stochastic
Hydraulics and 5th International Conference on Water Resources and Environment
Research in Canada.
8. Sun, H. ,
Nelson,. M., Chen, F. and Husch, J. 2009. Soil Mineral Structural Water
Loss during Loi Analyses. Canadian Journal of Soil Science. Vol. 89,No.5,
p.603-610.
9. Sun, H,
Natter, C. and Lacombe, P., 2008. Erosion and Weathering
Processes in the Delaware River Basin. Proceedings of GANJ XXV
Environmental and Engineering Geology of Northeastern New Jersey, edited by M.
L. Gorring, p.27-38.
10. Sun, H.,
Hewins, D., Latini, D., and Husch, J. 2006. Changes in Impervious
Surface Area, Flood Frequency, and Water Chemistry within the Delaware River
Basin during the Past 50 Years: Initial Results. Proceedings of the 7th
Int. Conf. on Hydroscience and Engineering (ICHE-2006), Sep 10 -Sep
13,Philadelphia,USA ISBN: 0977447405.15pp.
Conference Presentations on Deicing
Salt and Its Environmental Impact
1. Grieshaber, T., Sulaman F., Margel L.,
Panuccio, E. Lawler, N and Sun, H., 2018. Salty Water Trend and
Sources of Salt in the Delaware River. In Water supply, hydrology and
hydrodynamics in New Jersey and the Delaware River Basin. Poster presentation at 35th Annual Meeting of the Geological Association of New
Jersey. Camden, New Jersey. 10/19/2018.
2. Hongbing Sun, Nicole Donato*, Maria Chaves, Muhammad Sarwar. 2017. Variations
of Lead Concentrations in Soil Profiles near an Interstate Highway in New
Jersey. Geological Society of America Abstracts with Programs. Vol. 49, No.
2. doi: 10.1130/abs/2017NE-290389
3. Sun, H., Sulaman,
F., Dell'oro, A., 2016. Changes of
mercury concentration in response to chloride complexation under deicing salt
condition. GSA Abstracts with Programs. 48, 2.
4. Sarwar, Muhammad, Panuccio, Elaine, Schwartz, Stephen, and Sun, Hongbing. 2015. Lead Concentrations in Soil Profiles of a Transect near an Interstate Highway in New Jersey. Geological Society of America Abstracts with Programs. Vol. 47, No. 3, p.71
5. Sun, Hongbing, Barton, Amber, Sarwar, Muhammad, And Panuccio, Elaine. 2015. Role of Phosphate in the Mobilization of Arsenic from Soil and Aquifer. Geological Society of America Abstracts with Programs. Vol. 47, No. 3, p.72
6. Sun, H. Barton, A., Sarwar, M., Gallagher,W.,Schwimmer, R.,2014. Geochemical Environment of Arsenic in Stream Water and Soil Solution. Geological Society of America Northeastern Section Annual Conference. Abstracts with Programs Vol. 46, No. 2.
7. Sun,H., Alexander, J., Gove.,B., 2014. Mobilization of Heavy Metals in Response to Deicing Salt Application. Geological Society of America Northeastern Section Annual Conference. Abstracts with Programs Vol. 46, No. 2.
8. Sun, H., Alexander, J., Gove, B., Pezzi, E.,Chakowski, N., and Husch, J., 2013. Mineralogical and Anthropogenic Controls of Stream Water Chemistry in Salted Watersheds. American Geophysical Union Annual Conference, 2013 Online Abstract.
9. Alexander, J., Pezzi, E., Gove, B.,
Sinpatanasakul, L., and Feher, C., Sun, H.,2013. Release of heavy metals
from soil due to application of winter deicing salt in a watershed. America
Water Work Association-NJ Annual Conference.3/20/2013. Honorable mention for
best undergraduate project presentation.
12. Sun, H. Huffine, M., Sinpatanasakul, L. and Husch, J., 2011, Using Na/Cl molar ratio for estimating sodium retention in artificially salted watersheds. GSA Abstracts with Programs Vol. 43, No.5.
12. Sinpatanasakul, L., Sun, H., and Husch, J., 2011 Effect of CaCl2 and NaCl Mixture as Winter Deicing Salt on the Sodium Retention, GSA Abstracts with Programs Vol. 43, No.5.
13. Sun, H., Lucarino, K., Huffine, M., Husch, 2010: Watershed Retention of Sodium due to the Application of Road Deicing Salt. Abstract submitted to the 5th International Conference on Water Resources and Environment Research, in Canada.
14. Maria A. Huffine*, Leeann K*. Sinpatanasakul, Ashleigh Layton, Kelly Luckarino and Hongbing Sun,2009. Retention of Sodium in the Centennial Lake Watershed. New Jersey Water Environmental Association 94th Annual Conference at Atlantic City. 4/30/2009. Received 1st place undergraduate project and presentation award.
15. Sun, H, Natter, C. and Lacombe, P., 2008. Erosion and Weathering Processes in the Delaware River Basin. Proceedings of GANJ XXV Environmental and Engineering Geology of Northeastern New Jersey, edited by M. L. Gorring, p.2.
16. Lucarino, K, Natter, C., Carlson, D., Hua, J. and Sun, H.,2008. Road Salt Application and Its Impact on Water Quality of the Delaware River. New Jersey Water Environmental Association 93rd Annual Conference at Atlantic City. Second place best student poster award.
____________________________________________________
Updated10/9/2021.
Hongbing Sun, email: hsun@rider.edu, phone 609-896-5185.